
Figure 6.
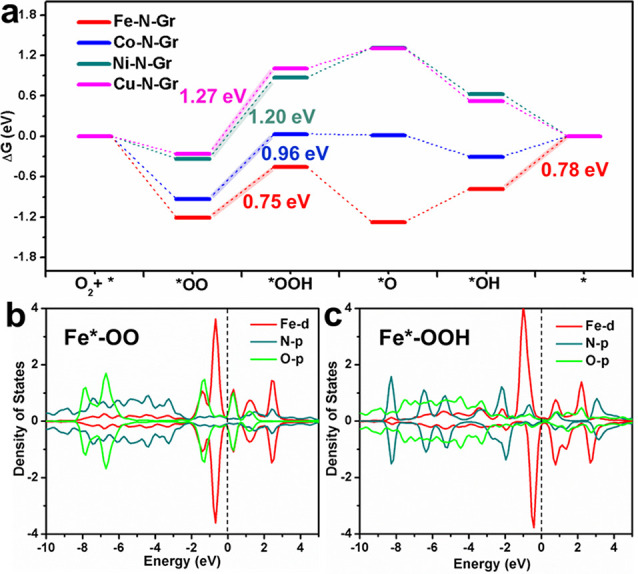
DFT simulations on ORR. (a) Free energy diagram on the M-N-Gr surface at equilibrium potential (U = 1.23 V). Blue, green, black, and red lines represent the doping atoms of Fe, Co, Ni, and Cu, respectively. Partial density of states (PDOS) of Fe doped intermediate stages for Fe*-OO (b) and Fe-*OOH (c). The red, blue, and green curves illustrated the PDOS of metal atoms’ d-orbitals and oxygen and nitrogen atoms’ p-orbitals. The Fermi level located at E = 0 eV.