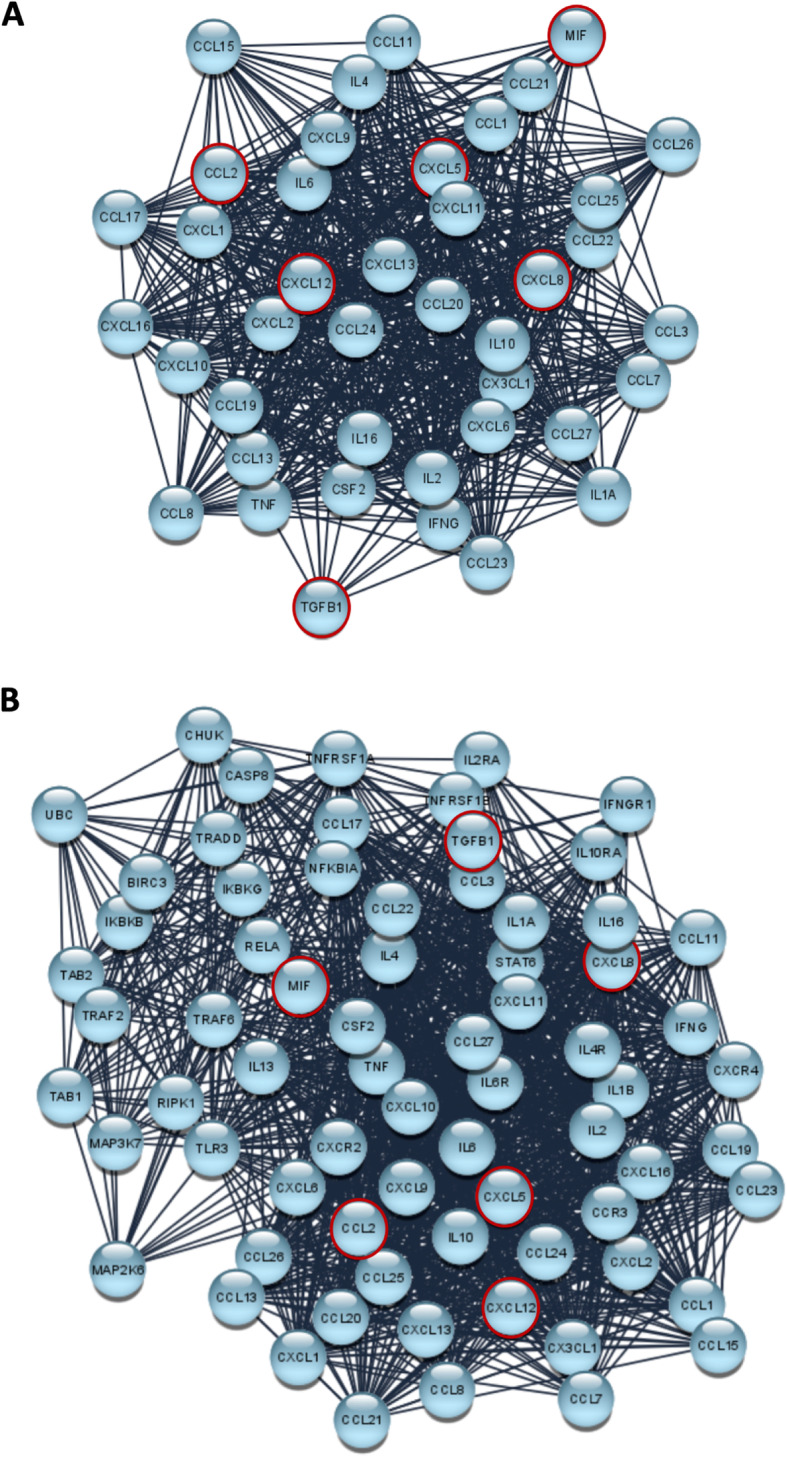
Fig. 6.

STRING analysis a) STRING analysis: CN: network representing the interaction among the examined cytokines (Cytokines Network, CN), as reported in STRING tool. The data are filtered for Homo sapiens and with a medium confidence score (0.400). The nodes and links are represented with the default layout and using the edge-weighted spring embedded layout (weighted for edge betweenness). The most relevant nodes as defined by PCA analysis are edged in red. b) STRING analysis: previous network after 4 cycles of enrichment (Enriched Cytokines Network, ECN). The nodes and links are represented with the default layout and using the edge-weighted spring embedded layout (weighted for edge betweenness). The most relevant nodes as defined by PCA analysis are edged in red
