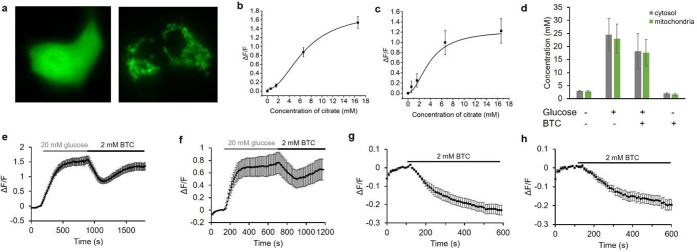
Figure 5.
Characterization of Citron1 in INS-1 cells. (a) Representative fluorescence images of INS-1 cells expressing Citron1 in the cytosol (left panel) and mitochondria (right panel). (b,c) In situ titration curve of Citron1 in the cytosol (b, n = 62) and mitochondria (c, n = 34). (d) Citrate concentration in the cytosol (gray) and mitochondria (green) in Krebs-Ringer buffer with or without 20 mM glucose/2 mM BTC treatment. Each quantification result is averaged from triplicates. (e,f) Glucose- and BTC-induced citrate changes in the cytosol (e, n = 49) and mitochondria (f, n = 14). (g,h) BTC-induced citrate changes in the cytosol (g, n = 7) and mitochondria (h, n = 10) in the absence of glucose. The results of quantification in (e–h) are summarized in (d). Error bars in (b–h) marks s.e.m.

