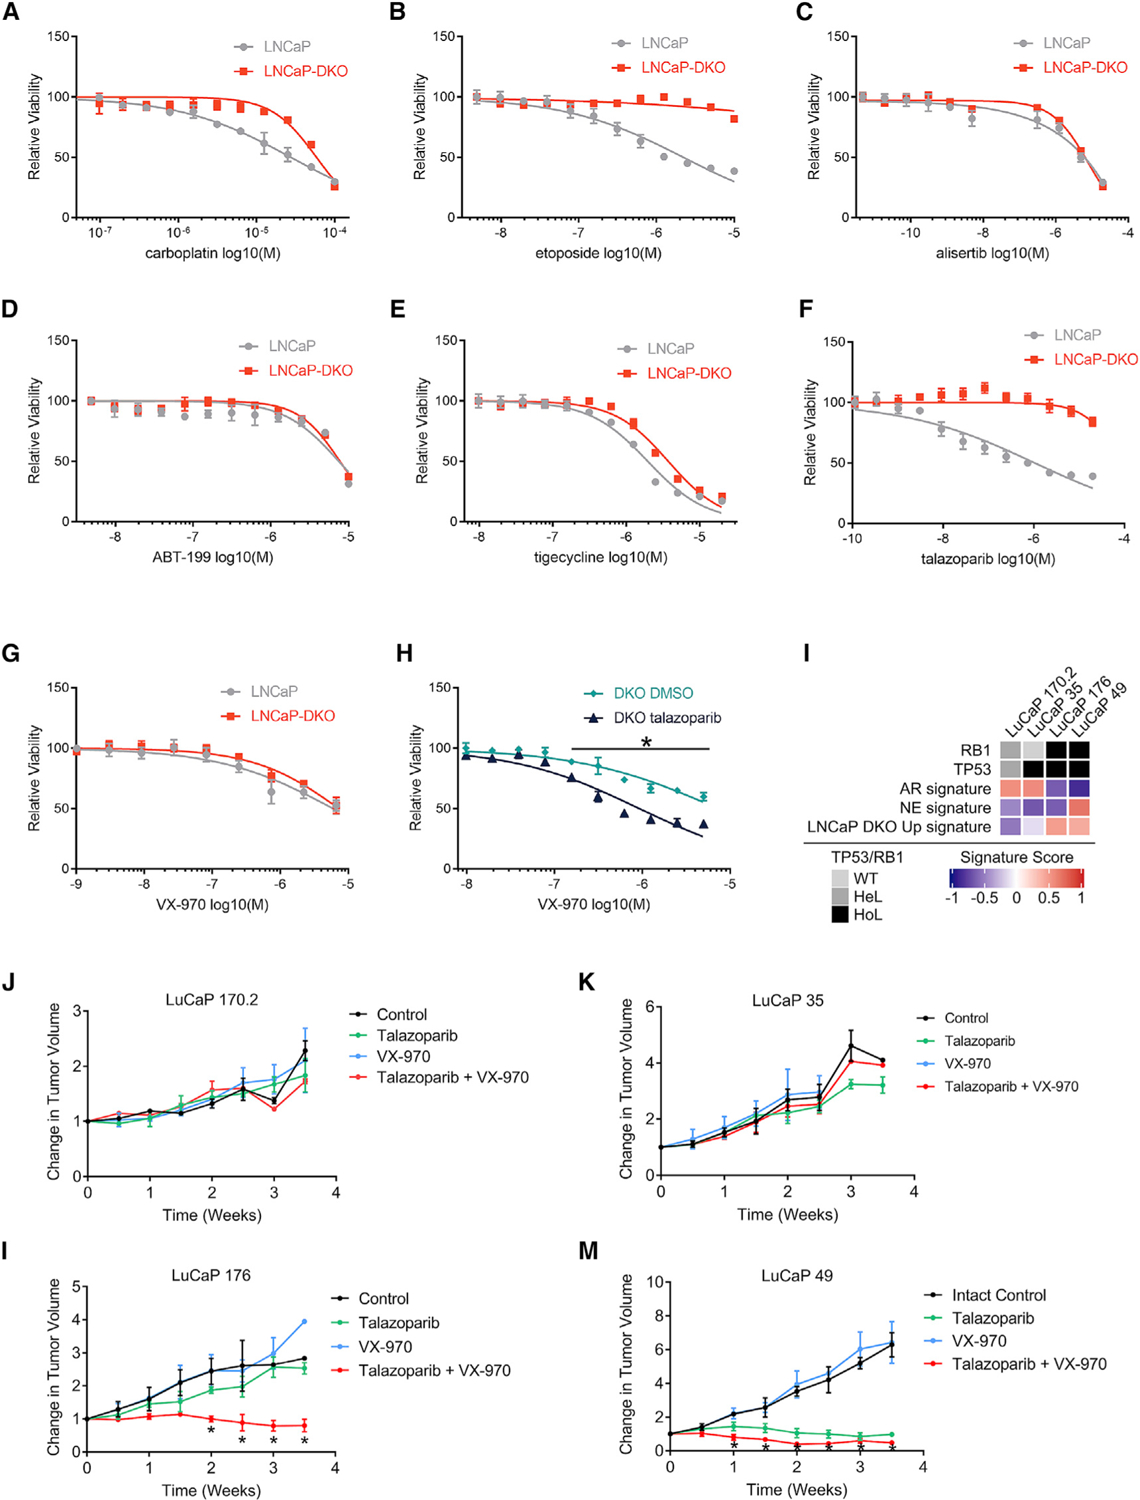
Figure 7. Combined TP53 and RB1 Loss Promotes Resistance to a Wide Range of Cancer Therapeutics but Enhanced Responses to Drugs Targeting DNA Replication Stress.

(A–G) Dose-response curves measuring LNCaP or LNCaPRB1−/−;TP53−/− DKO viability in response to (A) carboplatin, (B) topoisomerase II inhibitor etoposide, (C) AURKA inhibitor alisertib, (D) BCL2 inhibitor ABT-199, (E) MPT inhibitor tigecycline, (F) PARP inhibitor talazoparib, and (G) ATR inhibitor VX-970 (n = 4; *p ⩽ 0.05).
(H) Dose-response curves comparing a dose range of VX-970 on LNCaP-DKO cells cotreated with either 1 µM talazoparib or DMSO control (n = 4).
(I) Comparison of GSVA signature scores between LuCaP PDX models with differing TP53 and RB1 mutational status (average of n = 2–3 tumors per model per treatment arm).
(J–M) Relative change in tumor volumes plotted for LuCaP PDX models (J) LuCaP170.2, (K) LuCaP35, (L) LuCaP176, and (M) LuCaP49 treated with VX-970, talazoparib, or both drugs, compared to the vehicle control (M) LuCaP49. Asterisks indicate that groups were compared by unpaired, two-tailed t tests with multiple testing correction; FDR ⩽ 0.05; Error bars = SD.
See also Figure S7.
