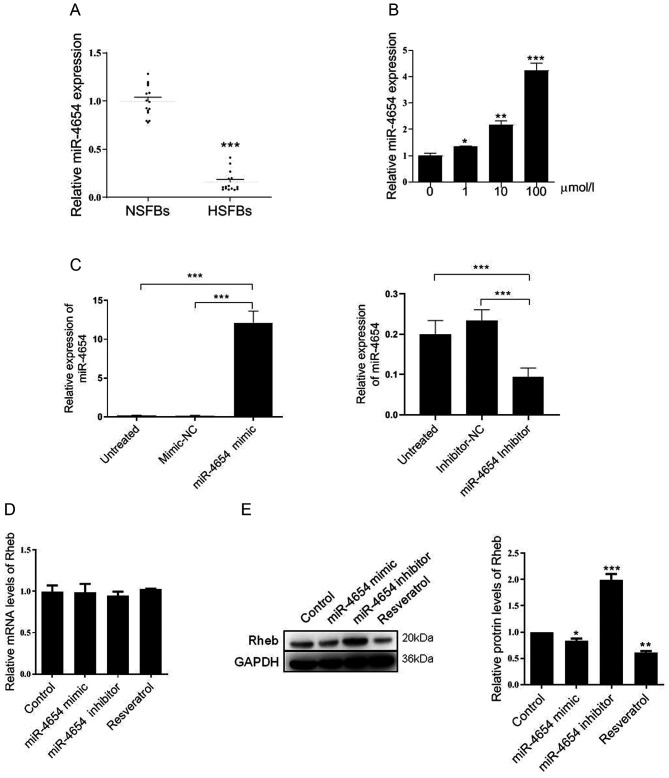
Figure 2.
Effect of miR-4654 on Rheb expression. (A) Relative expression levels of miR-4654 in NSFBs and HSFBs. N=14, ***P<0.001 vs. NFSBs. (B) RT-qPCR was performed to analyze the miR-4654 expression levels in HSFBs following the treatment with resveratrol at different concentrations. *P<0.05, **P<0.01, ***P<0.001 vs. 0 µmol/l group. (C) Transfection efficiency of miR-4654 mimic or miR-4654 inhibitor in HSFBs was determined using RT-qPCR. ***P<0.001. (D) RT-qPCR was performed to analyze the mRNA expression levels of Rheb in HSFBs transfected with miR-4654 mimic or miR-4654 inhibitor or treated with 100 µmol/l resveratrol. (E) Western blotting was used to analyze the protein expression levels of Rheb in HSFBs transfected with miR-4654 mimic or miR-4654 inhibitor, or treated with 100 µmol/l resveratrol. *P<0.05, **P<0.01, ***P<0.001 vs. the control group. Both the mRNA and protein expression levels from parts (D) and (E) were normalized to GAPDH. Data are presented as the mean ± SD; n=3. HSFBs, hypertrophic scar-derived fibroblasts; NSFBs, normal skin-derived fibroblasts; Control, mimic-NC + inhibitor-NC + PBS group; RT-qPCR, reverse transcription-quantitative PCR; miR, microRNA.

