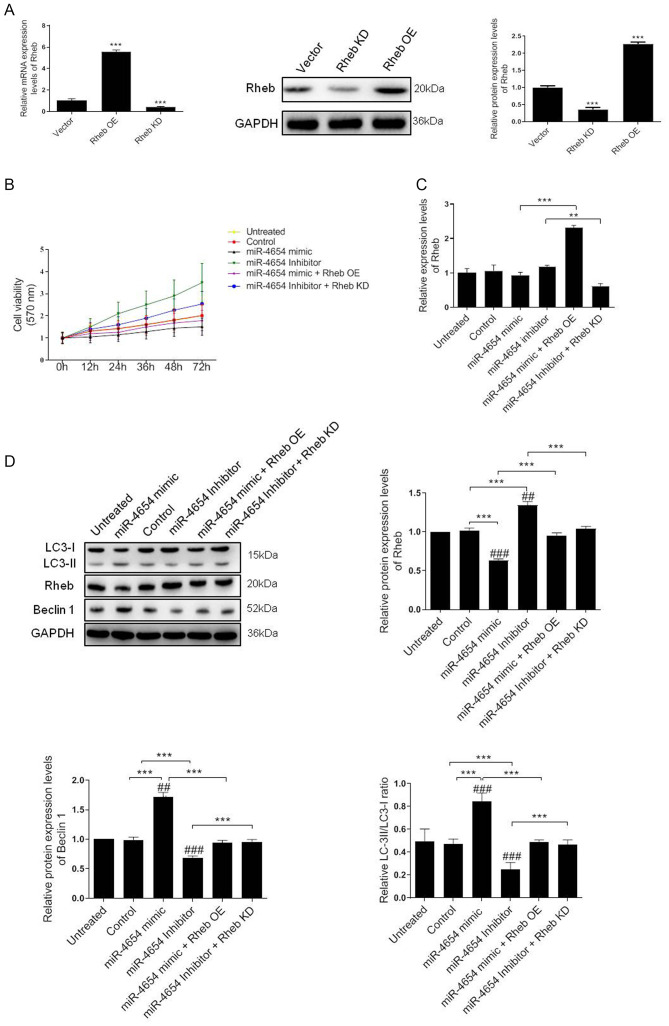
Figure 4.
Effect of miRNA-mediated Rheb downregulation on the viability and autophagy of HFSBs. (A) HFSBs were transfected with the Rheb OE plasmid, Rheb KD plasmid or the empty control vector. The mRNA and protein expression levels of Rheb were analyzed using RT-qPCR or western blotting, respectively. ***P<0.001 vs. vector group. (B) MTT assay was performed to determine the cell viability in each group at 72 h. (C) RT-qPCR analysis of Rheb expression levels in HFSBs in the different groups. **P<0.01, ***P<0.001. (D) Western blotting was used to determine the protein expression levels of Beclin 1, Rheb and LC3 in HFSBs in the different groups. ***P<0.001; ##P<0.01, ###P<0.001 vs. the untreated group. Data are presented as the mean ± SD from three independent experiments. HSFBs, hypertrophic scar-derived fibroblast; OE, overexpression; KD, knockdown; Control, mimic-NC + inhibitor-NC + vector treated group; LC3, microtubule-associated protein 1A/1B-light chain 3; miR, microRNA; RT-qPCR, reverse transcription-quantitative PCR.

