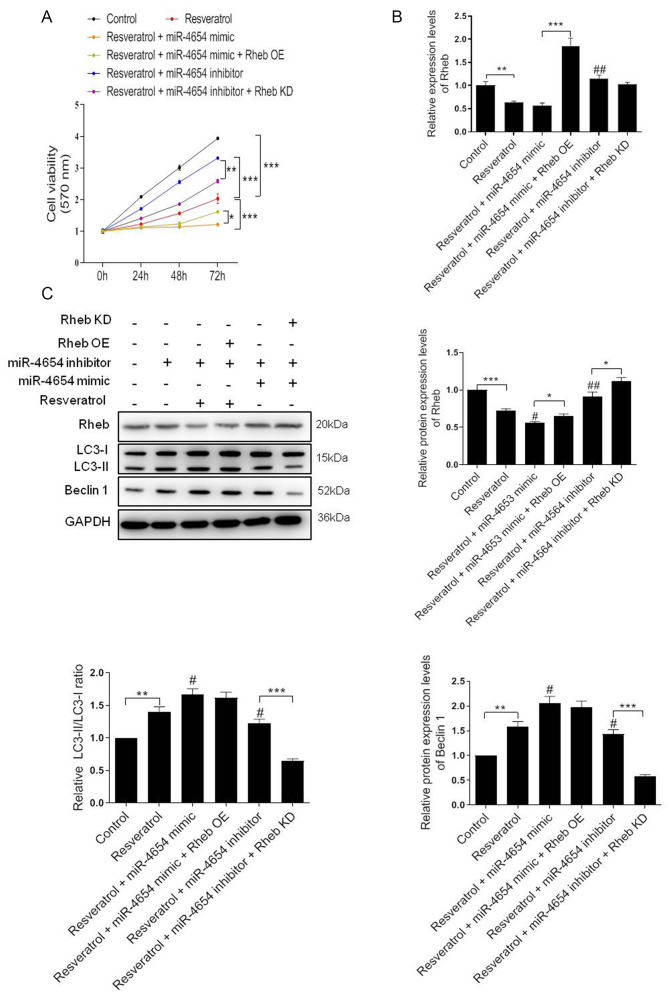
Figure 5.
Resveratrol activates autophagy through the miR-4654/Rheb axis. (A) Cell viability was analyzed in HSFBs in the different groups using an MTT assay. *P<0.05, **P<0.01, ***P<0.001. (B) RT-qPCR analysis of the expression levels of Rheb in HSFBs in the different groups. **P<0.01, ***P<0.001; ##P<0.01 vs. the resveratrol group. (C) Western blotting was used to analyze the protein expression levels of Rheb, LC3 and Beclin 1 in HSFBs in the different groups. *P<0.05, **P<0.01, ***P<0.001; #P<0.05, ##P<0.01 vs. the resveratrol group. Data are presented as the mean ± SD. N=3. HSFBs, hypertrophic scar-derived fibroblasts; LC3, microtubule-associated protein 1A/1B-light chain 3; Control, mimic-NC + inhibitor-NC + PBS + vector group; OE, overexpression; KD, knockdown; miR, microRNA.

