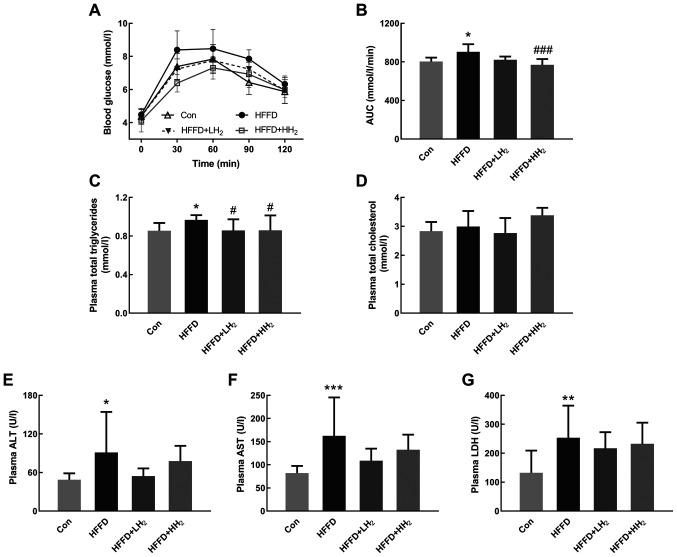
Figure 2.
Effects of H2 inhalation on OGTT and plasma biochemical values. (A) Curve of OGTT and (B) AUC of OGTT (n=10 per group). Concentrations of (C) plasma total triglycerides, (D) total cholesterol, (E) ALT, (F) AST and (G) LDH (n=8–12 per group). Data are shown as mean ± standard deviation. *P<0.05, **P<0.01 and ***P<0.001 vs. the Con group; #P<0.05 and ###P<0.001 vs. the HFFD group. OGTT, Oral glucose tolerance test; AUC, area under the curve; ALT, aminotransferase; AST, aspartate aminotransferase; LDH, lactic dehydrogenase; Con, control group; HFFD, high fat and fructose diet group; LH2, low H2 group; HH2, high H2 group.

