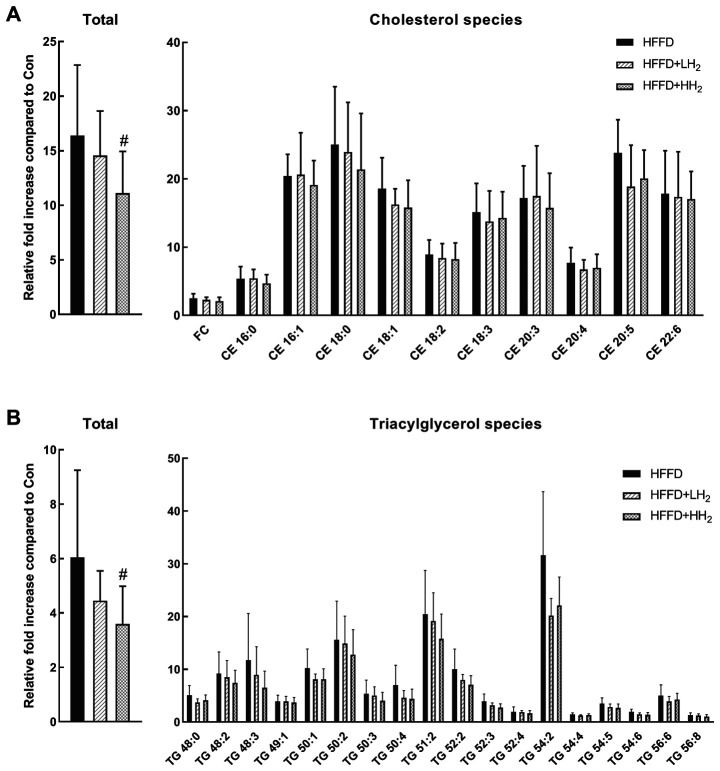
Figure 3.
Total and different species of cholesterol and triglycerides in the liver tissues from different groups. (A) total and cholesterol species of HFFD, HFFD + LH2 and HFFD + HH2 groups; (B) total and triacylglycerol species of HFFD, HFFD + LH2 and HFFD + HH2 groups. #P<0.05 vs. the HFFD group. n=8–10 per group. Con, control group; HFFD, high fat and fructose diet group; LH2, low H2 group; HH2, high H2 group; FC, free cholesterol; CE, cholesteryl ester; TG, triacylglycerol.

