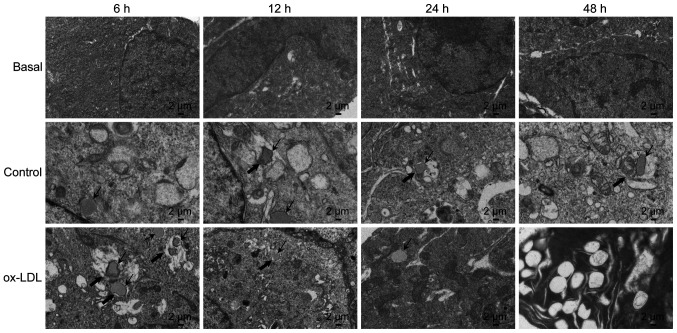
Figure 4.
Reduction of lipophagy in HUVECs when exposed to ox-LDL. HUVECs were untreated (basal group) or treated with either 50 µg/ml LDL (control group) or 100 µg/ml ox-LDL for 6, 12, 24 or 48 h. Scale bar, 2 µm. Thick arrows indicate autolipophagosome formation, and thin arrows indicate lipid droplets (n=3 per group). HUVEC, endothelial cell; ox-LDL, oxidized low-density lipoprotein.

