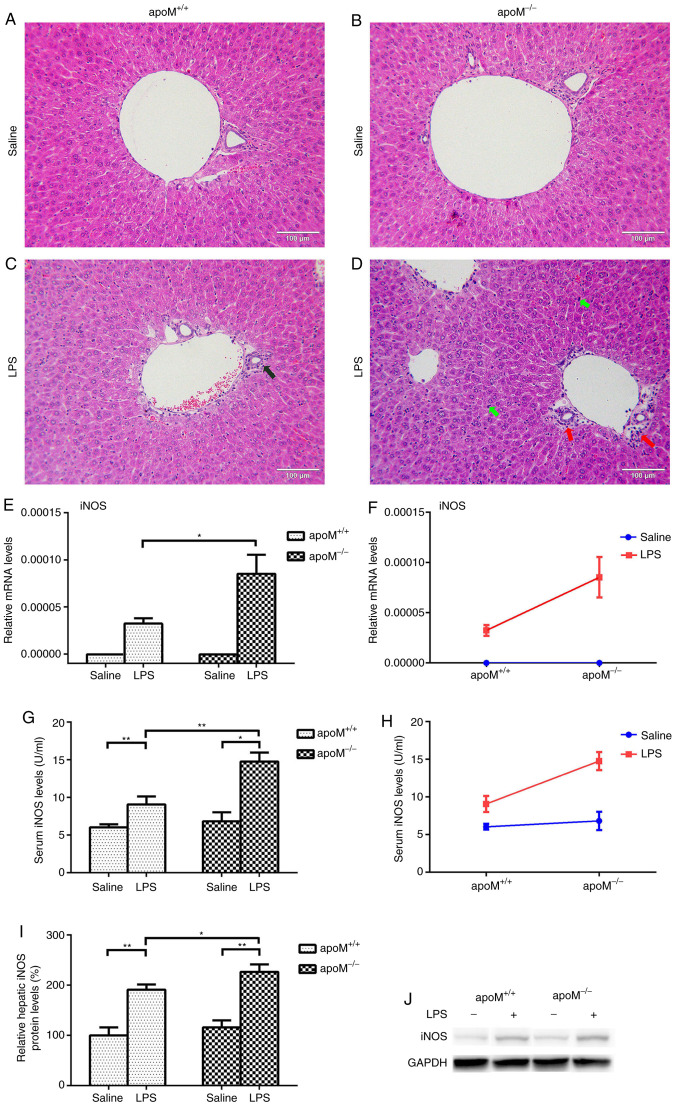
Figure 1.
Confirmation of the successful establishment of an LPS-induced inflammatory mouse model. Mice (n=6 per group) were randomly assigned to receive intraperitoneal injections of 0.9% saline (100 µl) or LPS (10 mg/kg in 100 µl saline) 3 times, once every 24 h. (A-D) Hematoxylin and eosin staining of mouse livers. The black arrow indicates a small number of inflammatory cells in the liver portal area of an apoM+/+ mouse treated with LPS. The red arrow indicates a large number of inflammatory cells in the liver portal area of an LPS-treated apoM−/− mouse. Green arrows indicate an increased number of Kupffer cells in the liver of an LPS-treated apoM−/− mouse. Liver sections, 5 µm; magnification, ×200; scale bar=100 µm. (E, G and I) Effects of LPS and/or apoM on hepatic and serum expression levels of iNOS in apoM−/− and apoM+/+ mice. (F and H) Effects of cross interaction between apoM and LPS on iNOS expression levels. (J) Western blot analysis. Data are presented as the means ± standard error or the mean. *P<0.05 and **P<0.01. LPS, lipopolysaccharide; apoM, apolipoprotein M; iNOS, inducible nitric oxide synthase.

