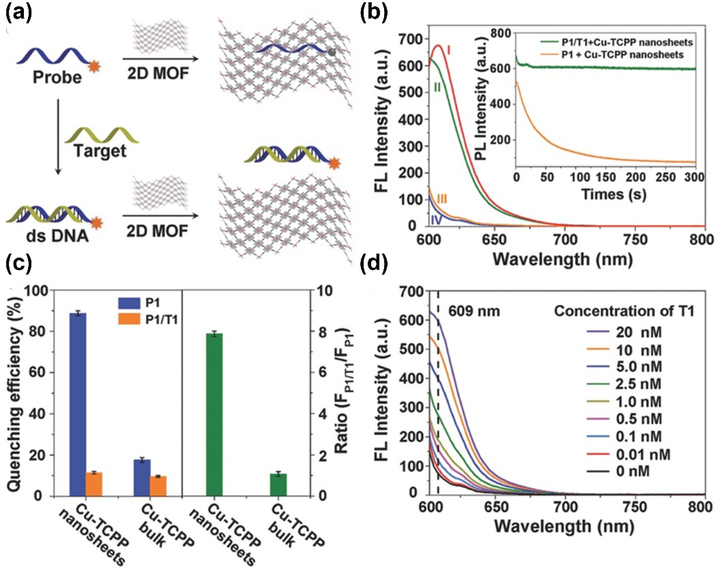
Fig.12.
(a) Schematic illustration of DNA sensing using 2D MOF. (b)The fluorescence intensity of (I) P1(Texas red-labeled ssDNA), (II) P1 + Cu-TCPP + complementary DNA(T1), (III) P1+ Cu-TCPP, (IV) Cu-TCPP. (c) Quenching efficiency and fluorescence intensity ratio in the presence of MOF nanosheets or bulk MOFs (d) Fluorescence recovery when treated with different concentrations of T1. Reprinted with permission from Ref [89]. Copyright 2015, Viley-CH

