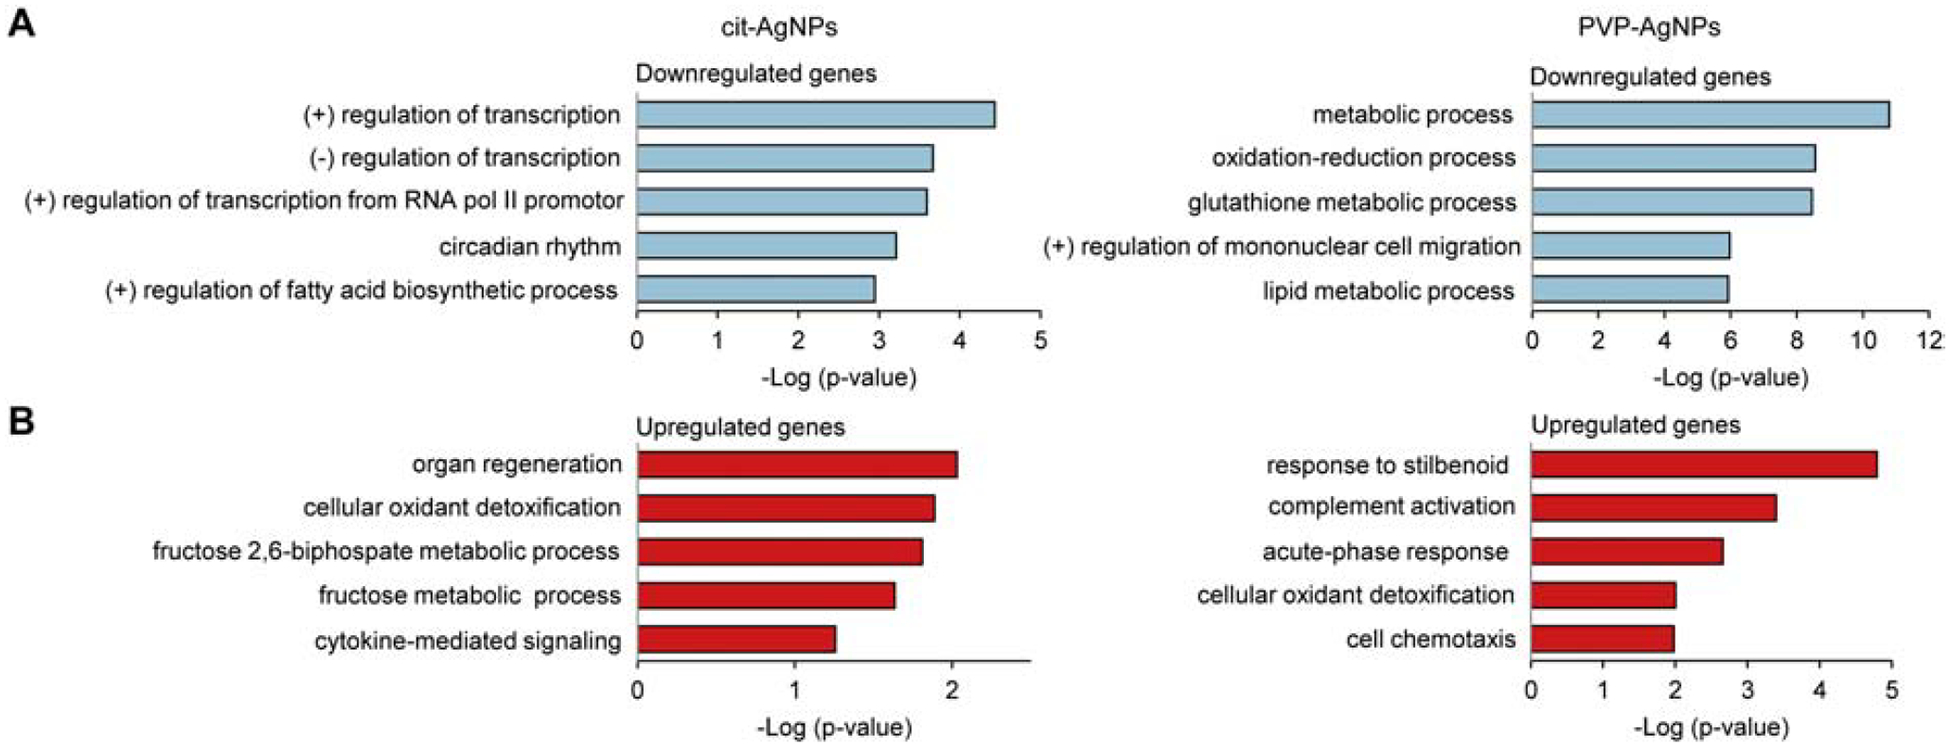
Fig 3. GO term enrichment of differentially expressed genes in cit-AgNP and PVP-AgNP exposed mice.

(A) Downregulated genes. (B) Upregulated genes. Top five significantly enriched GO terms in the biological process category are shown. The higher minus Log(p-value), the more significant association a particular GO term has with the gene list. (+), positive; (−), negative.
