Figure 6.

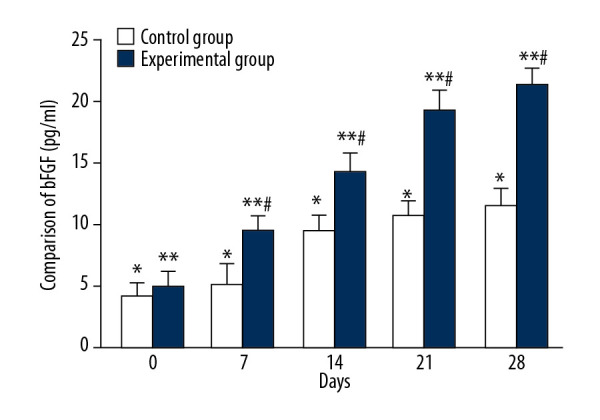
Comparison of bFGF changes between CPCF and KFS groups during treatment. * P<0.05 compared to each tested day of KFS group; ** P<0.05 compared to each tested day of CPCF group; # P<0.05 compared to KFS group on the same day.

Comparison of bFGF changes between CPCF and KFS groups during treatment. * P<0.05 compared to each tested day of KFS group; ** P<0.05 compared to each tested day of CPCF group; # P<0.05 compared to KFS group on the same day.