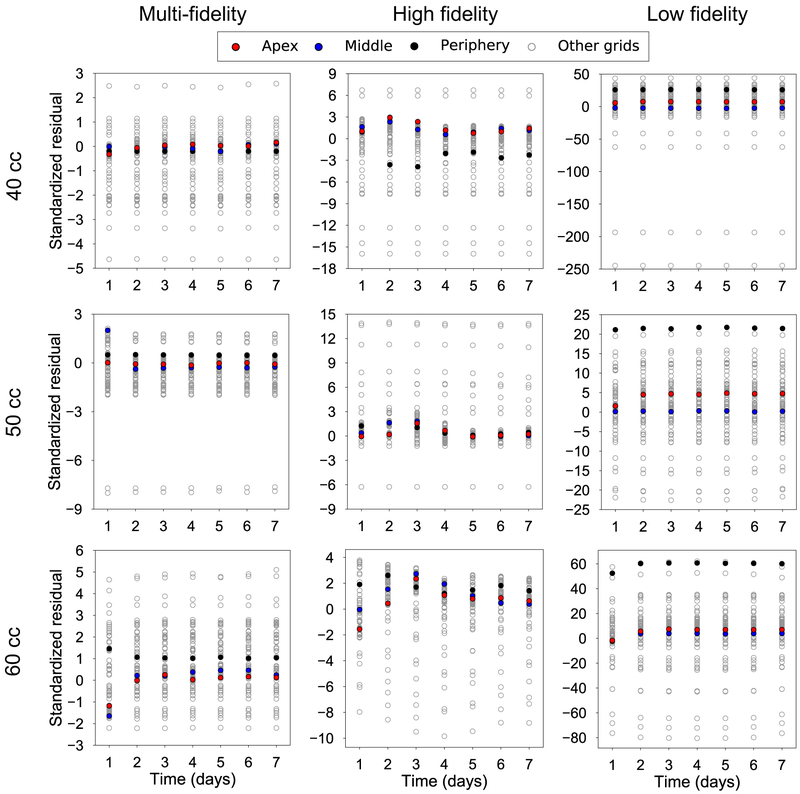
Figure 5:
Validation of the temporal response predicted by the surrogates against the corresponding high fidelity simulation. The test input is the mean of the parameters in Table 1. The standardized residuals are shown for the 100 grid points for three volumes of interest, V = 40, 50, and 60 cc. If the surrogates are trained properly, the standardized residuals should fall within the [−3, 3] confidence intervals as can be observed for the multi-fidelity GPs.

