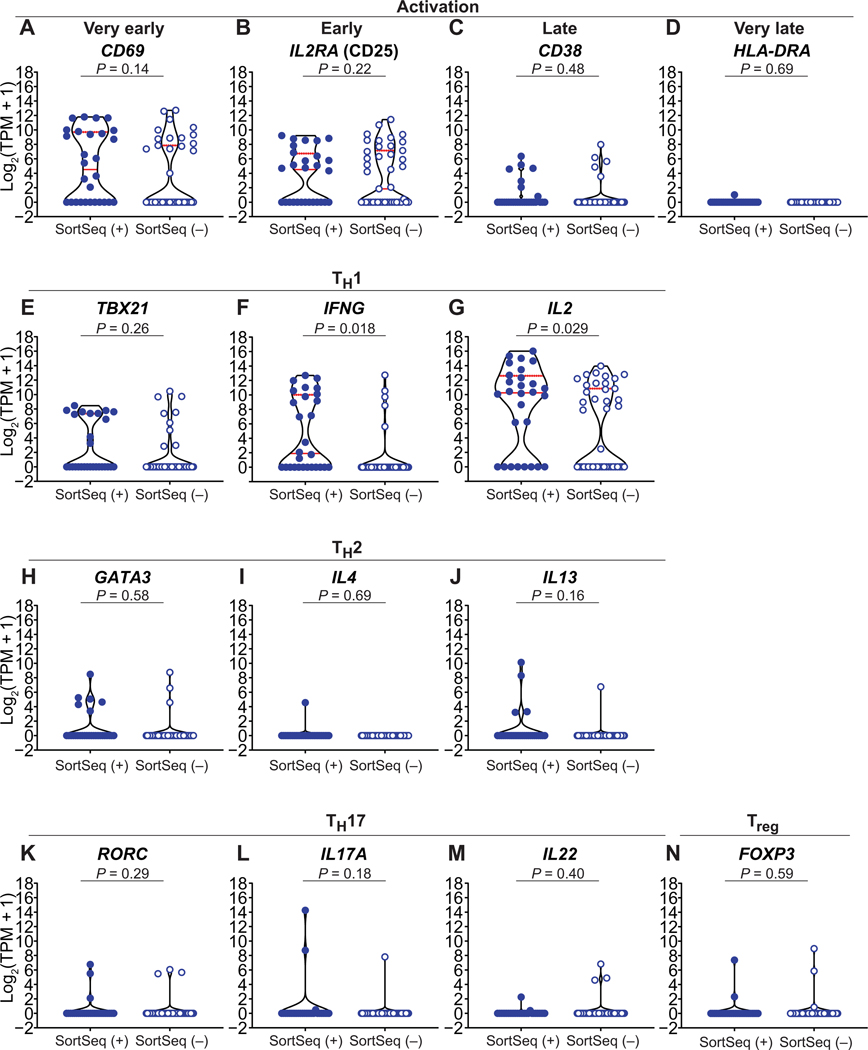
Fig. 2. HIV-1 SortSeq+ cells are polarized to TH1 phenotype.
(A to D) RNA expression of T cell activation markers CD69 (A), IL2RA (CD25) (B), CD38 (C), and HLA-DRA (D) from HIV-1 SortSeq+ and SortSeq− cells from ART-treated, virally suppressed, HIV-1–infected individuals. (E to N) RNA expression of representative T cell polarization signatures of TH1 (E to G), TH2 (H to J), TH17 (K to M), and Treg (N) from HIV-1 SortSeq+ and SortSeq− cells. Each dot represents a single cell from 28 SortSeq+ and 43 SortSeq− cells. Red lines denote median expression. Dashed red lines denote 75th expression percentile.

