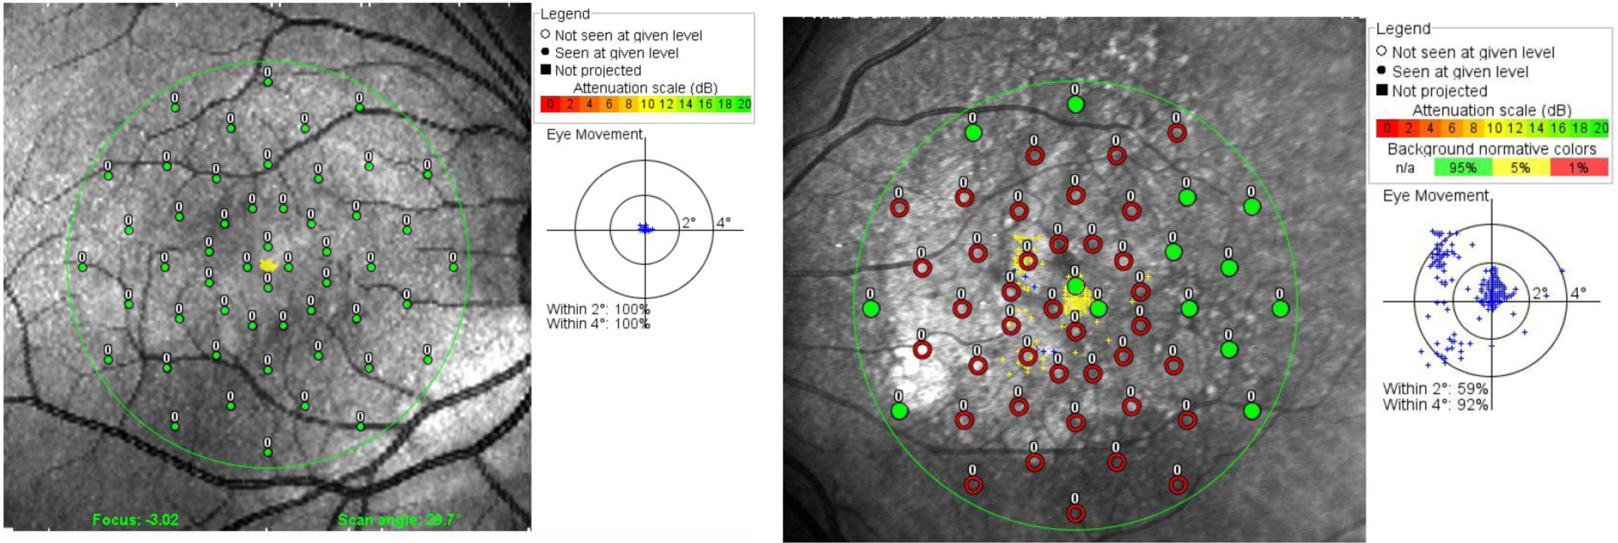
Figure 2. Microperimetry.

Suprathreshold testing results are presented for a healthy retina (left) and a dry AMD patient with a foveal-sparing central vision loss. Targets are presented in retinal co-ordinates - green points signify sighted areas, in which the patient detects even the faintest (−20dB) targets; red points signify areas of absolute vision loss where even the most intense targets were missed. The inset figures show the distribution of eye fixations (blue dots). With dry AMD, the fixation distribution demonstrates scattering and clustering that is not present in normal fixations.
