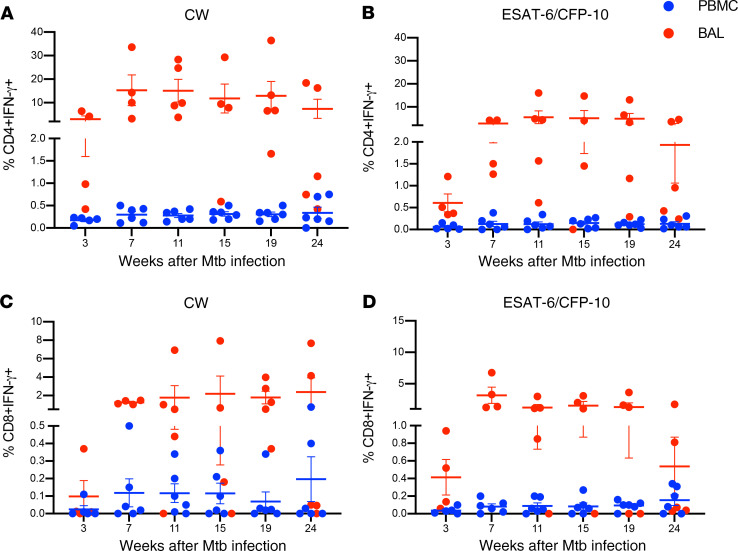
Figure 3. Kinetics of M. tuberculosis–specific CD4+ and CD8+ T cells producing IFN-γ in PBMCs and BAL.
PBMCs (blue circles) and BAL (red circles) were stimulated with CW and ESAT-6/CFP-10 peptide pools, and IFN-γ production by CD4+ and CD8+ T cells was assessed by ICS and flow cytometry. IFN-γ–producing CD4+ (A and B) and CD8+ (C and D) T cells at indicated time points (weeks) post–M. tuberculosis infection in macaques (n = 6) with LTBI. CW-specific CD4+ (A) and CD8+ (C) T cell frequencies and ESAT-6/CFP-10–specific CD4+ (B) and CD8+ (D) T cell frequencies in PBMCs and BAL are shown. Horizontal lines indicate the mean with SEM. Wilcoxon’s matched-pairs signed rank test was used to compare the frequencies of IFN-γ–producing CD4+ and CD8+ T cells between BAL and PBMCs.

