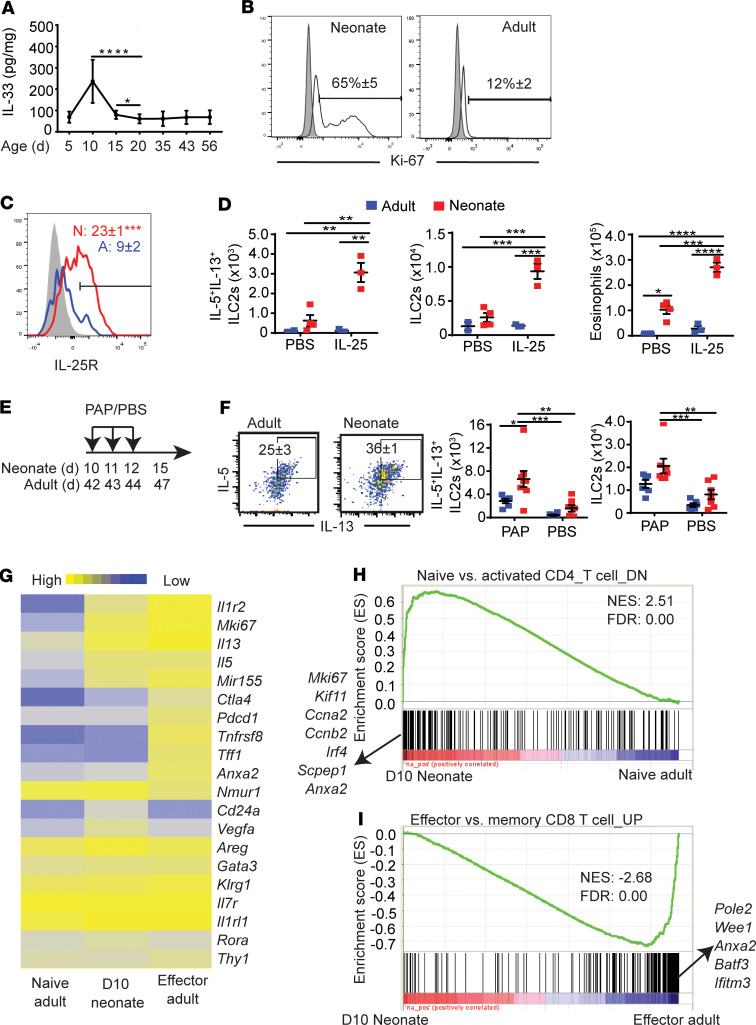
Figure 1. Neonatal ILC2s are activated by endogenous IL-33.
(A) The amount of IL-33 in whole lung homogenates of naive mice at indicated ages (n > 4). (B) Ki-67 expression of neonatal (day 10) and adult (4–6 weeks) lung ILC2s (gated as in Supplemental Figure 1A) (n = 4). Shading indicates isotype control; white indicates anti-Ki-67. (C) Neonatal and adult ILC2s were examined for IL-25R/IL-17RB expression (n = 5). Shading indicates isotype control. Numbers in the plot indicate the mean percentage ± SEM. (D) B6 neonates (red squares) and adults (blue squares) were treated with 1 administration of i.n. IL-25 on postnatal day 10 and 42, respectively. Three days later, numbers of IL-5+IL-13+ ILC2s, total ILC2s, and eosinophils in the lungs were analyzed by flow cytometry (n = 3–4, 2 independent experiments). (E) Scheme of i.n. papain (PAP)/PBS injections (n = 5–8, 2 independent experiments). d, days after birth. (F) Flow cytometry plots show intracellular IL-5 and IL-13 expression in ILC2s in adult and neonatal papain-treated mice. Numbers in flow plots represent the percentage of double-positive ILC2s ± SEM. Scatterplots show numbers of IL-5+IL-13+ ILC2s and total ILC2s. Blue squares represent adults; red squares represent neonates. (G) Heatmap shows the relative expression levels of genes in lung ILC2s from naive adults (8 weeks of age), day 10 neonatal pups, and effector adults (8 weeks of age) that have been given three 0.25 μg IL-33 i.n. injections and then harvested 1 day after the last injection (n = 3 per condition, each replicate represents sorted ILC2s from 8 pooled mice). (H) Gene set enrichment analysis (GSEA) of neonatal ILC2s vs. naive adult ILC2s. The log2-fold change for each comparison was ranked in descending order and compared with the immunological signatures gene set (C7). The x axis shows where the members of the gene set appear in the ranked list of genes. The y axis represents the enrichment score. The highest ranked genes are listed on the x axis. The genes that were downregulated in naive CD4 T cells compared with activated CD4 T cells were significantly enriched in neonatal day 10 ILC2s. (I) GSEA of neonatal ILC2s and effector adult ILC2s. Genes that were upregulated in effector CD8 T cells compared with memory CD8 T cells were enriched in effector adult ILC2s. NES, normalized enrichment score; FDR, false discovery rate. *P < 0.05; **P < 0.01; ***P < 0.005 (1-tailed unpaired Student’s t test for C, 2-way ANOVA with Bonferroni’s post hoc test for D and F).

