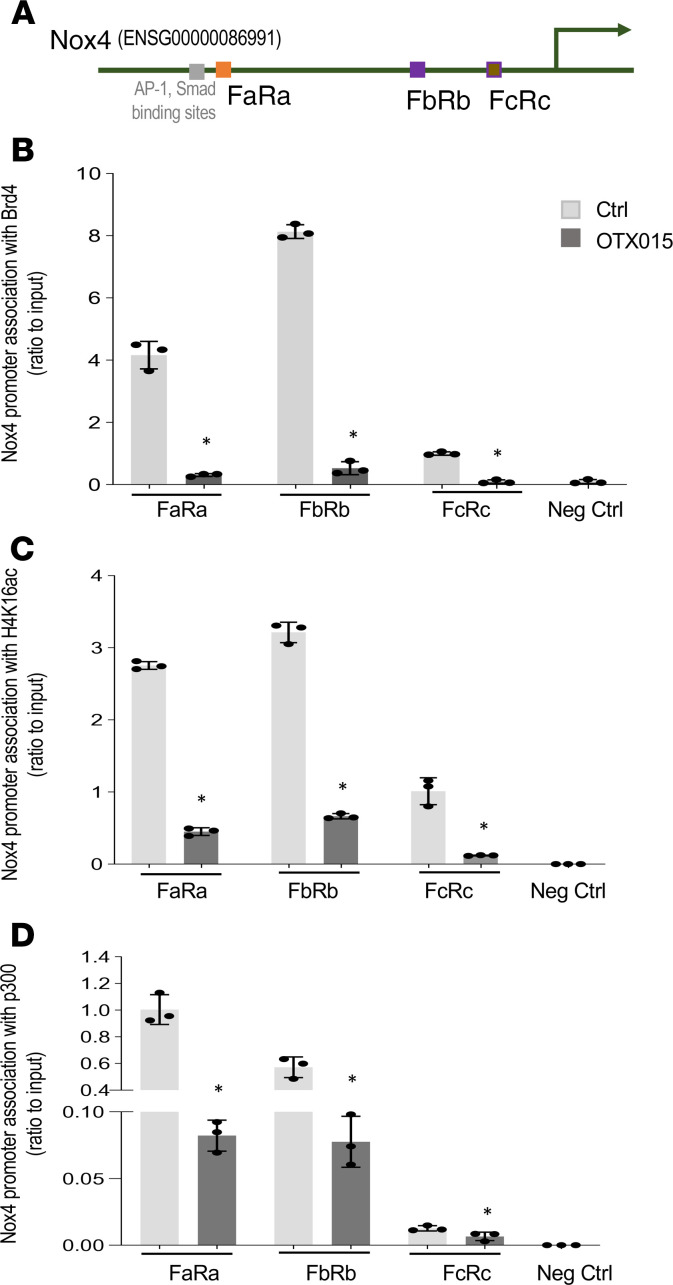
Figure 3. BET inhibitor OTX015 blocks the Nox4 promoter association with Brd4, H4K16ac, and p300 in IPF fibroblasts.
(A) Schematic of the relative locations of 3 PCR primer sets used to examine the association of transcriptional complex proteins with Nox4 (ENSG00000086991) by ChIP assays. (B–D) Primary IPF lung fibroblasts were treated with vehicle or OTX015 (0.5 μM) for 48 hours before the cells were subjected to ChIP assays. The Nox4 promoter region association with Brd4, H4K16Ac, and p300 was analyzed by ChIP assays, with primer sets indicated in A. DNA was immunoprecipitated with specific antibodies against Brd4 (B), H4K16Ac (C), and p300 (D). The relative levels of the PCR product are represented in the bar graphs as Nox4 promoter region association with Brd4, H4K16ac, or p300. Negative control represents IgG pull-down. qPCR data were analyzed by the 2-ΔΔCt method and were normalized to input DNA, expressed as fold change relative to primer set FcRc or FaRa. The values are expressed as mean ± SD from average of 3 independent experiments of 1 representative cell line. *P < 0.05, OTX015-treated compared with control (vehicle only), by 2-tailed t test.

