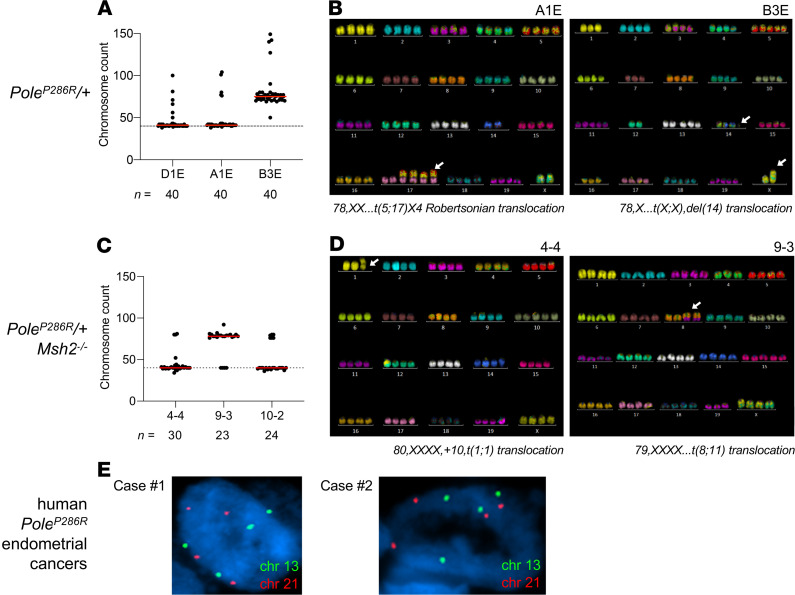
Figure 2. SKY of mouse cancer cell lines.
(A) Chromosome counts of individual cells in PoleP286R/+ cell lines (n = 3). The normal diploid chromosomal complement (n = 40) is shown by a dotted line. All cell lines show some cells in tetraploid range, with 1 line (B3E) being predominantly tetraploid. (B) Representative SKY images of tetraploid cells from 2 lines as shown, showing only rare chromosomal translocations. The white arrows point to the translocations indicated below each image. (C) Chromosome counts of individual cells in PoleP286R/+Msh2–/– cell lines (n = 3). The normal diploid chromosomal complement (n = 40) is shown by a dotted line. All lines show some cells in tetraploid range, with 1 line (9-3) being predominantly tetraploid. (D) Representative SKY images of tetraploid cells from 2 lines as shown, showing only rare chromosomal translocations. The white arrows point to the translocations indicated below each image. (E) Ploidy analysis by interphase FISH of tissue sections. Representative images of single nuclei from 2 human PoleP286R/+ cases (confirmed by Sanger sequencing of exon 9) showing tetraploidy, with slides counterstained with DAPI.

