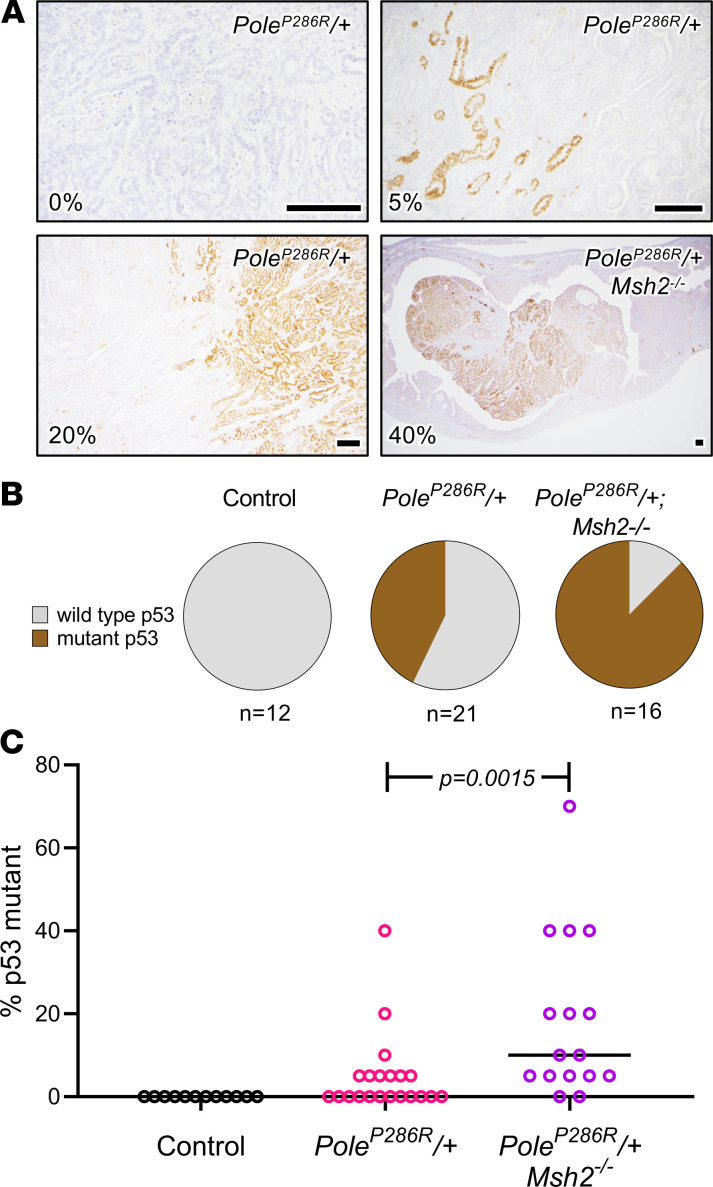
Figure 3. Trp53 mutations are common late events in PoleP286R-driven endometrial cancers.
(A) Presence of Trp53-mutant clones per immunohistochemistry (IHC). Fields are selected at varying magnifications to best show each mutant clone. The percentage of tumor cells expressing p53 (5%, 10%, 20%, etc.) for the entire tissue section (not just the field shown) was semiquantitatively estimated and shown in the lower left-hand corner for each panel. The upper left panel shows an example of a tumor with no mutant clone. Scale bars: 200 μm. (B) Pie charts summarizing analysis as in A, for all tumors. Tumors were scored on presence or absence of Trp53-mutant clones by IHC. (C) Percentage of p53-positive cells in each tumor shown in B, P value per 2-tailed Mann-Whitney U test, showing that p53-expressing clones are significantly larger in PoleP286R/+Msh2–/– tumors.

