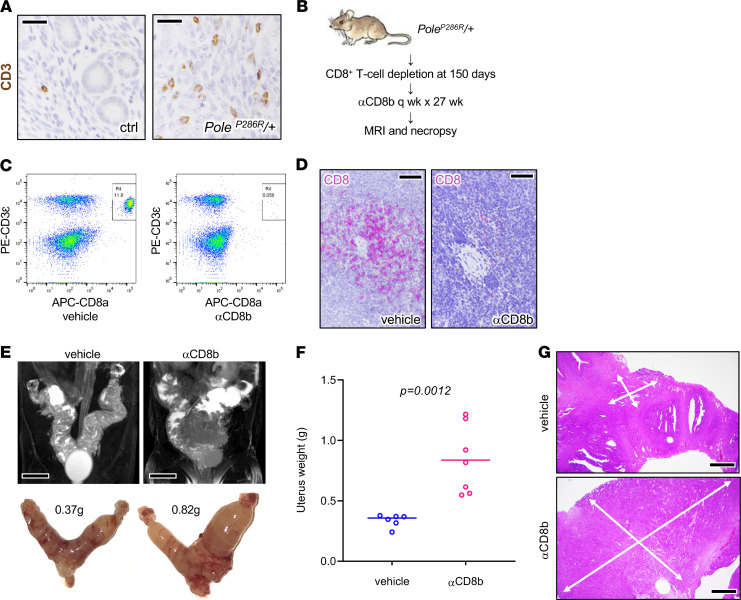
Figure 6. Acceleration of tumor progression following T cell depletion.
(A) CD3 IHC highlighting T cells, normal uterus versus tumor, with slides counterstained with hematoxylin. Scale bars: 25 μm. (B) Schematic summarizing CD8+ T cell depletion protocol. (C) αCD8 antibody resulted in near total CD8+ T cell depletion (inset boxes) in peripheral blood sampled 6 days after the first CD8 antibody injection. x axis, allophycocyanin-stained CD8; y axis, phycoerythrin-stained CD3ε. (D) IHC of CD8+ T cells in splenic tissue shows systemic tissue depletion. Tissue obtained 3 days after 27 weeks of treatment. Scale bars: 40 μm. (E–G) Mice euthanized after 27-week interval as shown in C. (E) MRI and matching gross images of uteri, from representative control and experimentally treated mice. Scale bars: 0.5 cm. (F) Uterus weights in control (n = 6) versus treated mice (n = 7), P value per 2-tailed Mann-Whitney U test. (G) Tumor burden per weight measurements likely underestimates overall tumor extent. White arrows show histologic extent of tumors. Scale bars: 250 μm.

