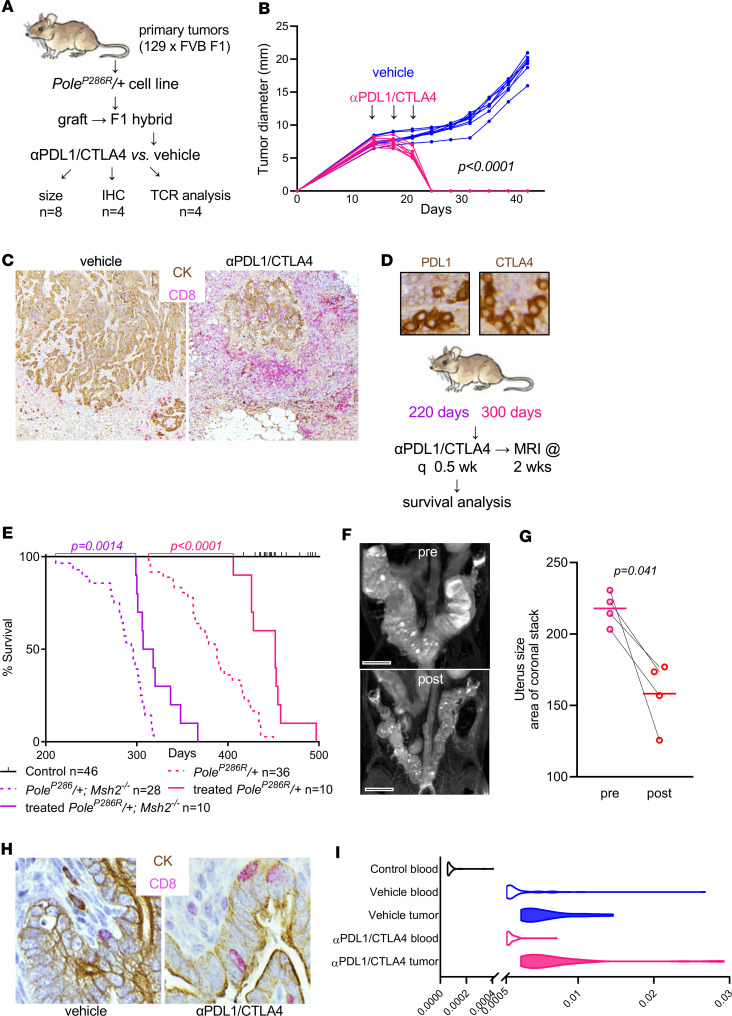
Figure 7. PoleP286R/+ and PoleP286R/+Msh2–/– tumors are highly responsive to immune checkpoint blockade.
(A) Schematic summarizing combined αPDL1/CTLA-4 treatment of syngeneically engrafted F1 hybrid mice. (B) Subcutaneous tumor graft measurements per Vernier caliper twice a week; n = 8 grafts for vehicle and treated, P value per 2-way ANOVA grouped analysis. (C) Double-labeling of grafts by IHC against CD8 to highlight T cells and pan-cytokeratin (CK) to highlight tumor cells. (D) PDL1 and CTLA-4 expression in lymphocytes in representative PoleP286R/+ tumors and schematic of αPDL1/CTLA-4 treatment of live mice. (E) Survival analysis following treatment of PoleP286R/+ and PoleP286R/+Msh2–/– tumors, P value per log-rank test. (F) Z-stack MRI of PoleP286R/+ mouse uterus before treatment and 2 weeks posttreatment. Scale bars: 0.5 cm. (G) Tumor response per MRI Z-stacks; n = 4 matched (pre/post) pairs, P value by paired t test. (H) IHC of CD8 and CK highlights increased numbers of tumor-infiltrating lymphocytes within malignant gland epithelium. (I) Distribution of the 50 most frequent TCRs in peripheral blood and tumors of 129 × FVB F1 engrafted mice; n = 4 per group; x axis, frequency.

