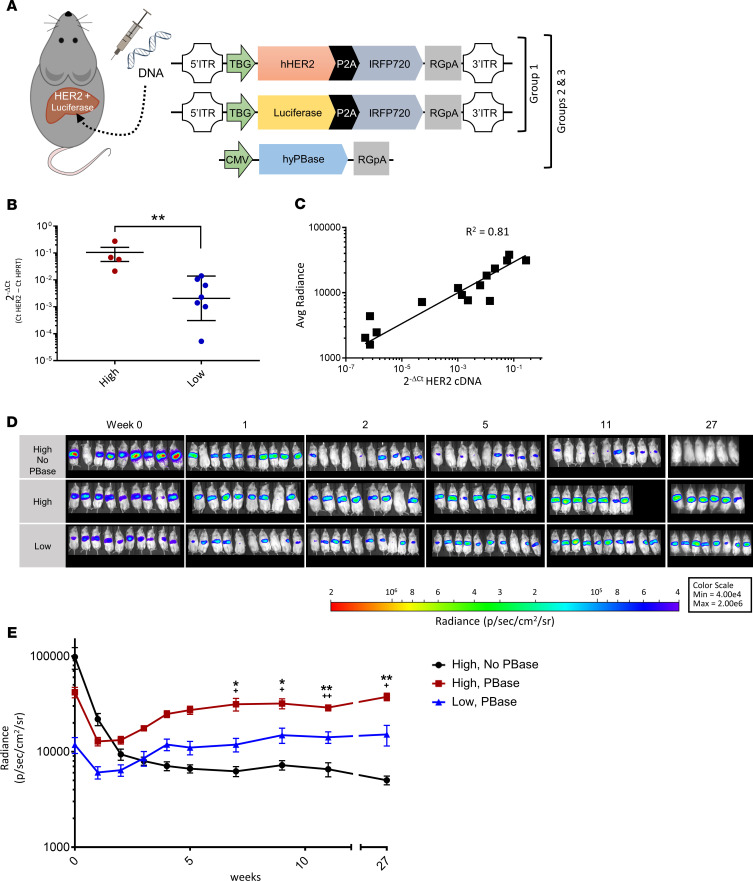
Figure 2. Murine expression of human antigen is stable and tunable using PiggyBac transposase gene transfer.
(A) Design of the luciferase and truncated human Her2 (hHer2) transposon vectors and the transposase vector used in the experiment. Group 1 mice were injected with 5 μg of the hHer2 transposon plasmid and 5 μg of the luciferase transposon plasmid, but no transposase plasmid. Group 2 mice were injected with 5 μg of the hHer2 transposon plasmid, 5 μg of the luciferase transposon plasmid, and 10 μg of the transposase plasmid, hyPBase. Group 3 mice were injected with the same plasmids as group 2 but at one-tenth the DNA concentration. (B) Comparison of hHer2 mRNA expression between mice that received higher versus lower concentrations of piggyBac transposon and transposase plasmids. hHer2 RNA was measured in murine livers using real-time PCR and normalized to mouse HPRT expression to calculate 2–ΔCt values. All data are shown as means ± SD (n = 4–7 mice per group). A 2-tailed Mann-Whitney U test of ΔCt values was used for statistical analysis. (C) Comparison of hHer2 DNA content and luciferase expression in the murine livers after hydrodynamic DNA injections (n = 15 mice). (D) In vivo imaging of luciferase expression in mice that either received piggyBac transposon but not transposase plasmid (group 1) or mice injected with either a higher or lower dose of piggyBac transposon and transposase plasmid (groups 2 and 3, respectively). (E) Mean ± SEM radiance over time with n = 9 mice per group. A 2-way repeated-measures ANOVA with Tukey’s multiple correction test was used for statistical analysis. Statistical significance for group 2 versus either group 1 (*) or group 3 (+) is denoted as */+P < 0.5 and **/++P < 0.01.

