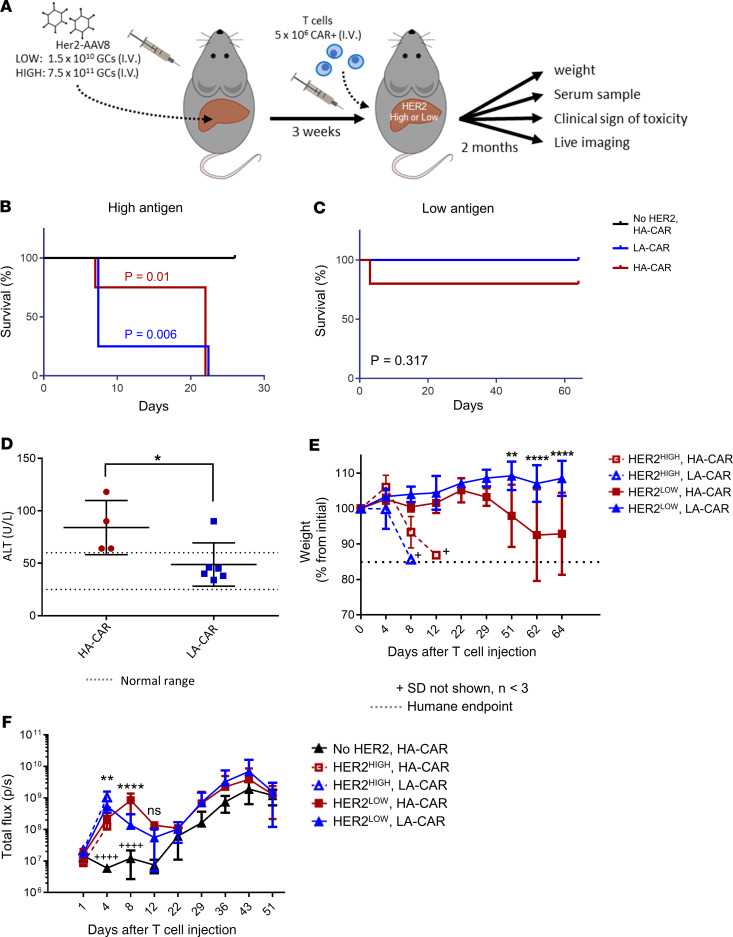
Figure 4. CARTs cause lethal on-target, off-tumor toxicity in mice.
(A) Overview of the experimental design for comparing on-target liver toxicity between affinity-tuned Her2 CARTs. Two groups of mice received either 1.5 × 10¹⁰ or 7.5 × 10¹¹ GCs of Her2-AAV8 and then were infused with either 5 × 10⁶ high-affinity (HA) or low-affinity (LA) Her2-CARTs. A control group of mice received 4 × 10¹¹ GCs of GFP-AAV8 (i.e., no Her2) and 5 × 10⁶ HA CARTs. n = 6 mice per group are shown in each panel, unless stated otherwise. (B) Survival curves of mice that received the 7.5 × 10¹¹ GCs of Her2-AAV8 and then CART injection. Statistical analysis was performed using a log-rank Mantel-Cox test. (C) Survival curves of mice that received the 1.5 × 10¹⁰ GCs of Her2-AAV8 and then CART injections. (D) Liver function profile as determined by serum ALT levels collected 25 days after T cell injection. Mean ALT ± SEM in mice (n = 4–6) that received 1.5 × 10¹⁰ GCs of Her2-AAV8 and either HA-CAR or LA-CAR. A 1-tailed unpaired 2-sample t test of ALT was used for statistical analysis. (E) Weight change shown by percent change from initial weight ± SD in mice that received either 7.5 × 10¹¹ (dashed lines) or 1.5 × 10¹⁰ (solid lines) GCs of Her2-AAV8 and then either HA-CAR or LA-CAR. (F) Mean total flux ± SD for whole body bioluminescence imaging (BLI) of T cell luciferase. A 2-way repeated measures ANOVA with Bonferroni’s multiple comparison test was used for statistical analysis of weight change and BLI. Statistical significance for D–F is denoted as *P < 0.5, **P < 0.01, ***P < 0.001, and ****/++++P < 0.0001.

