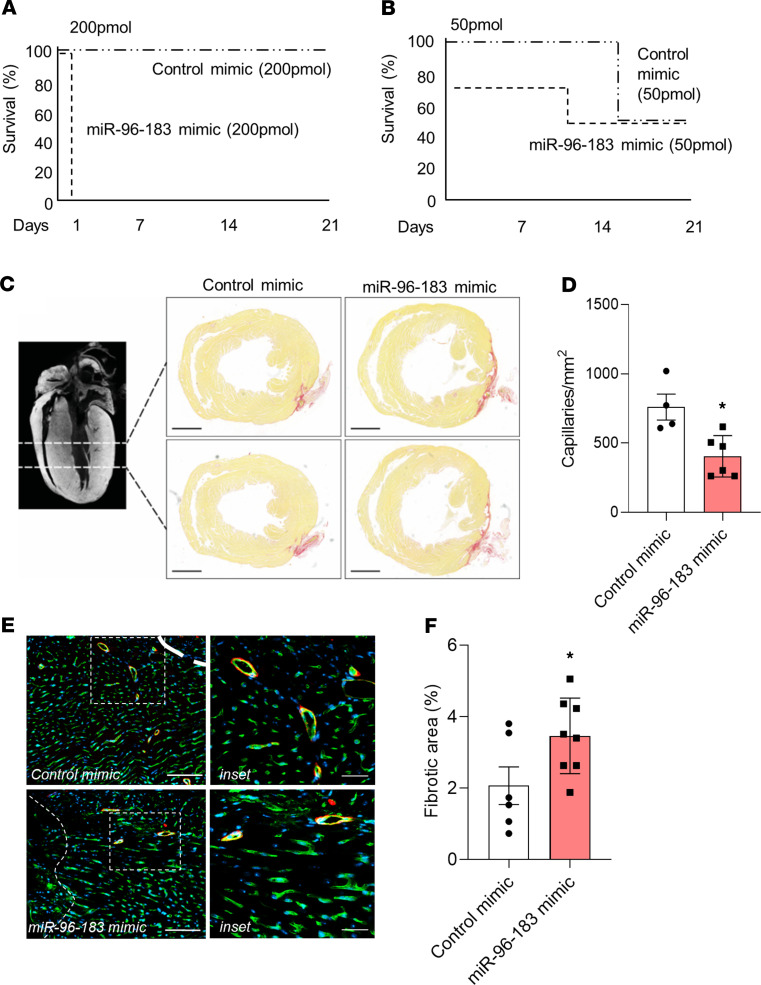
Figure 3. Mimic-mediated overexpression of miR-96 and miR-183 prevents scar tissue resolution and neovascularization of the neonatal mouse heart after MI.
(A and B) Survival curves show that, whereas all neonatal mice injected with a combination of miR-96 and miR-183 mimics at the dose of 200 pmol died within 24 hours after MI and mimic injection (A), the mortality rate of mice injected with miR-96 and miR-183 mimics at the dose of 50 pmol was similar to that of control mimic-injected mice (B). Representative microphotographs (C) and bar graph (D) (n = 6 control mimic, n = 8 miR-96/miR-183 mimic) showing differences in fibrosis deposition (in red, assessed by Picrosirius red staining) between neonatal infarcted hearts injected with either control mimics or miR-96 and miR-183 mimics. Scale bar: 1000 μm. Representative microphotographs (E) and bar graph (F) (n = 4 control mimic, n = 6 miR-96/miR-183 mimic) showing the reduced capillary density in the heart of neonatal mice subjected to MI and injected with miR-96 and miR-183 mimics compared with control injected mice. Capillaries are stained with isolectin-B4 (green fluorescence), and arterioles are stained with isolectin-B4 (green fluorescence) and α-smooth muscle actin (red fluorescence). Scale bar: 250 μm (left); 50 μm (right). *P < 0.05 vs. control mimic (Student’s t test). Analyses were performed at 21 days after MI. Data are shown as mean ± SEM.

