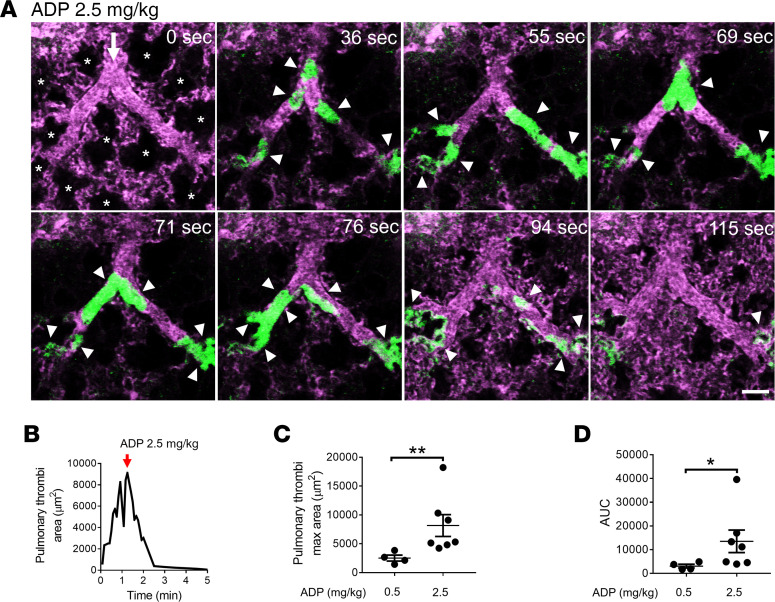
Figure 5. ADP triggers reversible acute pulmonary thrombosis in mice.
WT mice were IV administered either 0.5 mg/kg ADP (n = 4 mice) or 2.5 mg/kg ADP (n = 7 mice), and pulmonary circulation was imaged using qFILM. (A) qFILM images of the same field of view (FOV) at 8 different time points are shown. t = 0 seconds (s) corresponds to time point before IV ADP administration, and other displayed time points are relative to IV ADP. Pulmonary thrombosis was absent at t = 0 s. Following 2.5 mg/kg IV ADP, medium (500–1000 μm2) and large size (>1000 μm2) platelet-rich thrombi (white arrowheads) sequestered in the pulmonary arteriole (t = 36 s). The thrombi obstructed the arteriolar bottlenecks (t = 55 s), resulting in loss of the pulmonary blood flow, which was evident by the absence of the vascular dye (purple fluorescence) in the capillaries downstream of the embolized arteriole. Pulmonary thrombosis resolved and the capillary blood flow recovered (purple fluorescence was back) by t = 115 s. Platelets (green) and pulmonary microcirculation (purple). Asterisks denote alveoli. White arrows mark the direction of blood flow. The diameters of the arteriole is 41 μm. Scale bar: 50 μm. Complete qFILM time series corresponding to A is shown in Supplemental Video 9. (B) Pulmonary thrombi area plotted as a function of time to show changes in the total area of platelet-rich thrombi following 2.5 mg/kg IV ADP within FOV shown in A. Pulmonary thrombi maximum area value marked by red arrow. (C and D) Pulmonary thrombi max area and AUC were estimated to compare pulmonary thrombosis development in mice following 0.5 mg/kg IV ADP (n = 4 mice) and 2.5 mg/kg IV ADP (n = 7 mice). Pulmonary thrombi max area and AUC were compared using Wilcoxon-Mann-Whitney test. Data are shown as mean ± SEM. *P < 0.05, **P < 0.01 for 0.5 mg/kg vs. 2.5 mg/kg IV ADP.

