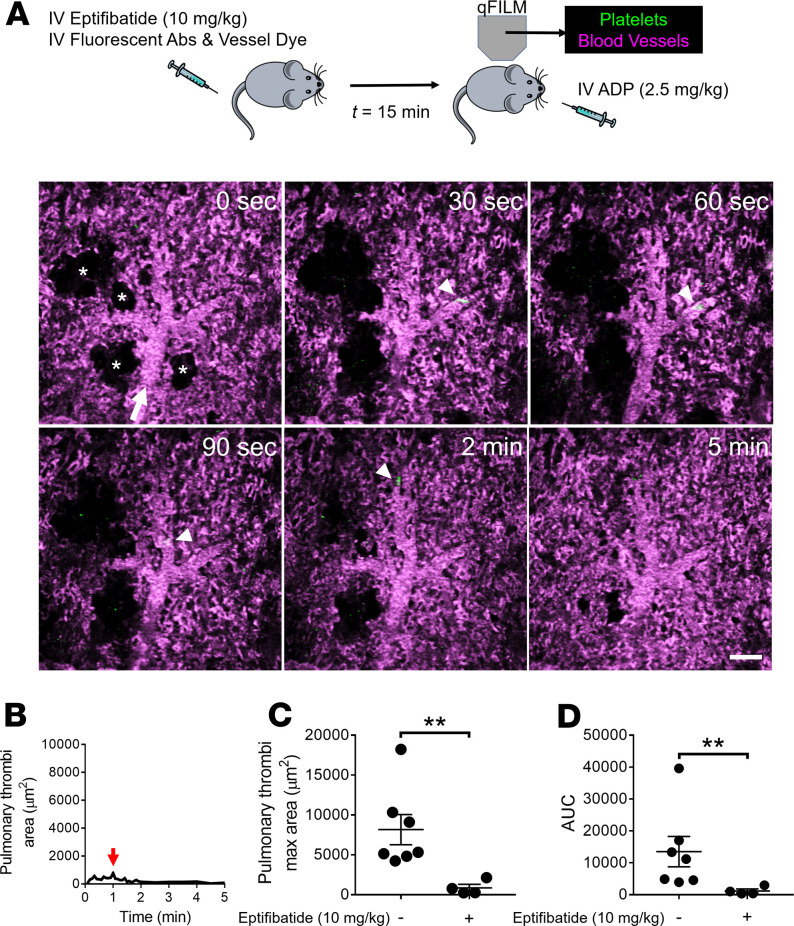
Figure 6. ADP-induced pulmonary thrombosis in mice is αIIbβ3 dependent.
(A) WT mice were IV administered 2.5 mg/kg ADP with or without IV administration of 10 mg/kg αIIbβ3 inhibitor (eptifibatide) 15 minutes before IV ADP. Pulmonary circulation was imaged using quantitative fluorescence intravital lung microscopy (qFILM). qFILM images of the same field of view (FOV) at 6 different time points are shown to assess the effect of eptifibatide on the development of IV ADP-dependent pulmonary thrombosis. t = 0 seconds (s) corresponds to time point before and t > 0 s correspond to time points immediately following IV ADP administration. Pulmonary thrombosis was absent at t = 0 s. ADP failed to evoke pulmonary thrombosis in mouse pretreated with eptifibatide. Platelets (green) and pulmonary microcirculation (purple). Asterisks denote alveoli. White arrow mark the direction of blood flow within the arterioles. The diameter of the arteriole shown is 38 μm. Scale bar: 50 μm. (B) Pulmonary thrombi area plotted as a function of time for the FOV shown in A. Red arrow indicates pulmonary thrombi maximum area. (C and D) Pulmonary thrombi max area and AUC in mice with (n = 4 mice) or without (n = 7 mice) pretreatment with eptifibatide before IV ADP. Pulmonary thrombi max area and AUC were estimated as described in Methods. Pulmonary thrombi max area and AUC were compared using Wilcoxon-Mann-Whitney test. Data are shown as mean ± SEM. **P < 0.01 when comparing with and without eptifibatide pretreatment.

