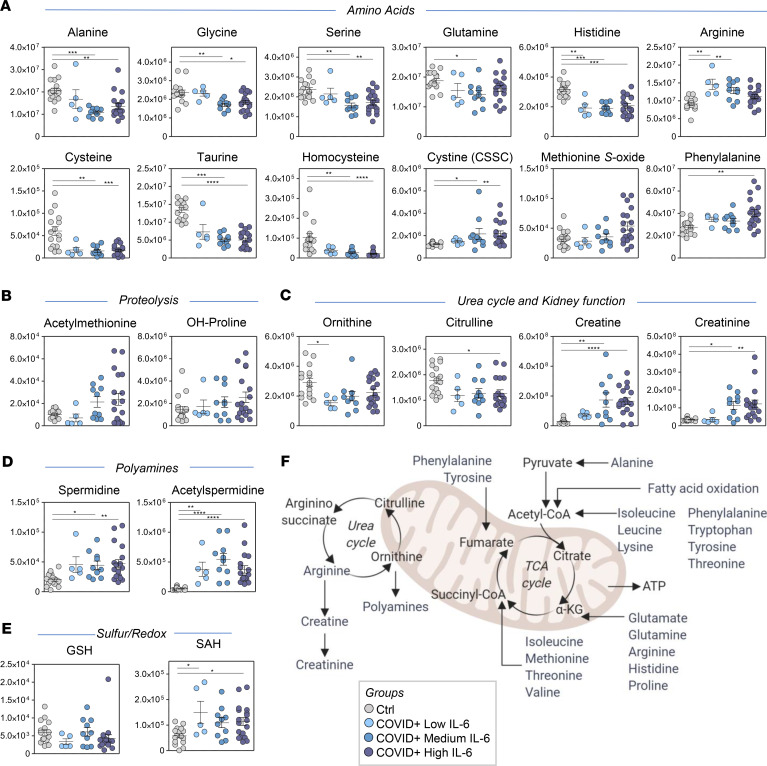
Figure 4. Amino acid levels and metabolism in sera of COVID-19–positive patients.
Serum levels of amino acids (A), proteolysis markers (B), urea cycle and renal function metabolites (C), polyamines (D), and sulfur-redox metabolism (E) showed significant differences between COVID-19–positive patients and controls. GSH, reduced glutathione; SAH, S-Adenosylhomocysteine. (F) An overview of the pathways related to these metabolites. Asterisks indicate significance by ANOVA (1-way ANOVA with Tukey’s multiple comparisons, *P < 0.05; **P < 0.01; ***P < 0.001; ****P < 0.0001). The y axis in the dot plots indicates AU.

