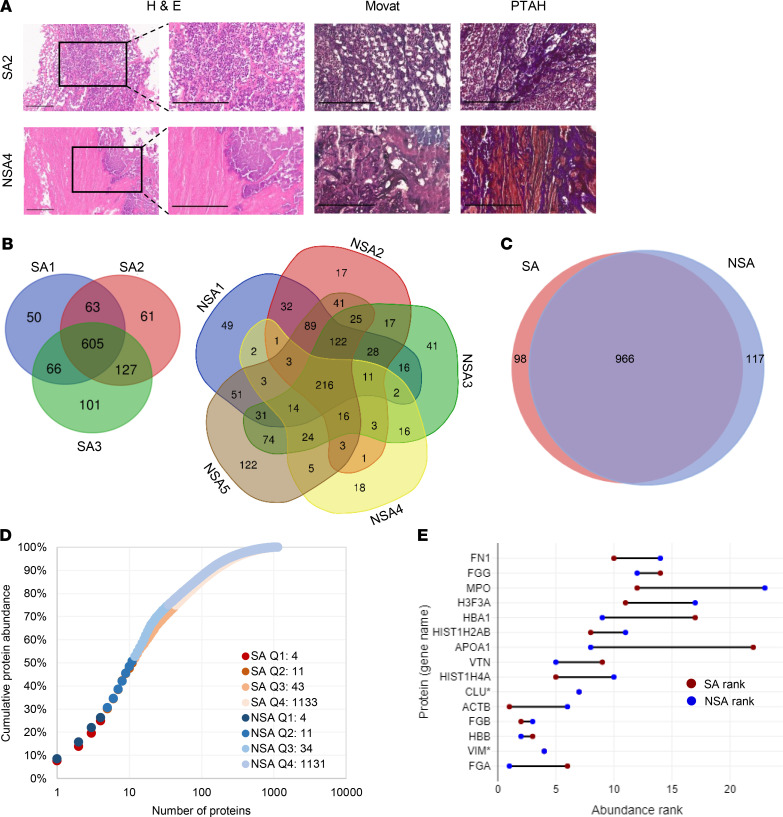
Figure 1. Vegetation histology and shotgun proteome overview.
(A) Vegetation staining with hematoxylin and eosin (H&E), Movat pentachrome (Movat), and phosphotungstic acid-hematoxylin (PTAH) illustrates contrasting levels of inflammation: numerous inflammatory cells in S. aureus 2 (SA2) and few in non–S. aureus 4 (NSA4) and abundant fibrin (PTAH stain, shown in purple). Movat staining disclosed no elastic fibers, collagen, or proteoglycans. The boxes in the left-hand panel indicate regions shown at higher magnification in the panels on their right. Scale bars: 300 μm, 200 μm for insets. (B) Venn diagrams summarizing shotgun proteomics data of S. aureus (SA) and non–S. aureus (NSA) vegetations. (C) Venn diagram showing overlap between the total shotgun proteome of SA and NSA vegetations. (D) Normalized protein ion abundance plot from the SA and NSA groups showing that the 15 most abundant proteins contributed to over 50% of the total protein abundance (Q1–Q4, proteins in each quartile). (E) The rank of the top 15 most abundant proteins in each group (* indicates the same rank in both groups).

