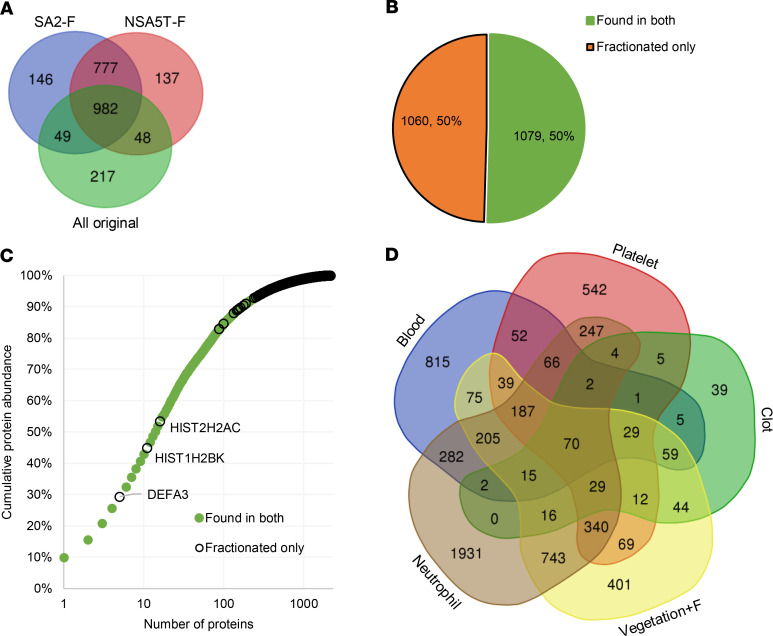
Figure 3. Fractionation increased vegetation proteome coverage by identifying numerous low-abundance proteins.
(A) Venn diagram showing the overlap between the 2 fractionated vegetations, S. aureus 2 fractionated (SA2-F) and non–S. aureus 5T fractionated (NSA5T-F), and all the proteins identified in vegetations by single-run analysis. (B) Pie chart showing that 50% of the proteins identified in the fractionated vegetations were not previously found in any of the vegetations. (C) Normalized protein ion abundance plot from the fractionated vegetations showing the contribution of the fractionation unique proteins (black circles) and the proteins found in the fractionated and nonfractionated vegetations to the overall vegetation proteome. Proteins within the top 80th percentile are labeled by gene symbol. (D) Venn diagram of all vegetation proteomes (including after fractionation) with reported blood, platelet, clot, or neutrophil proteomes.

