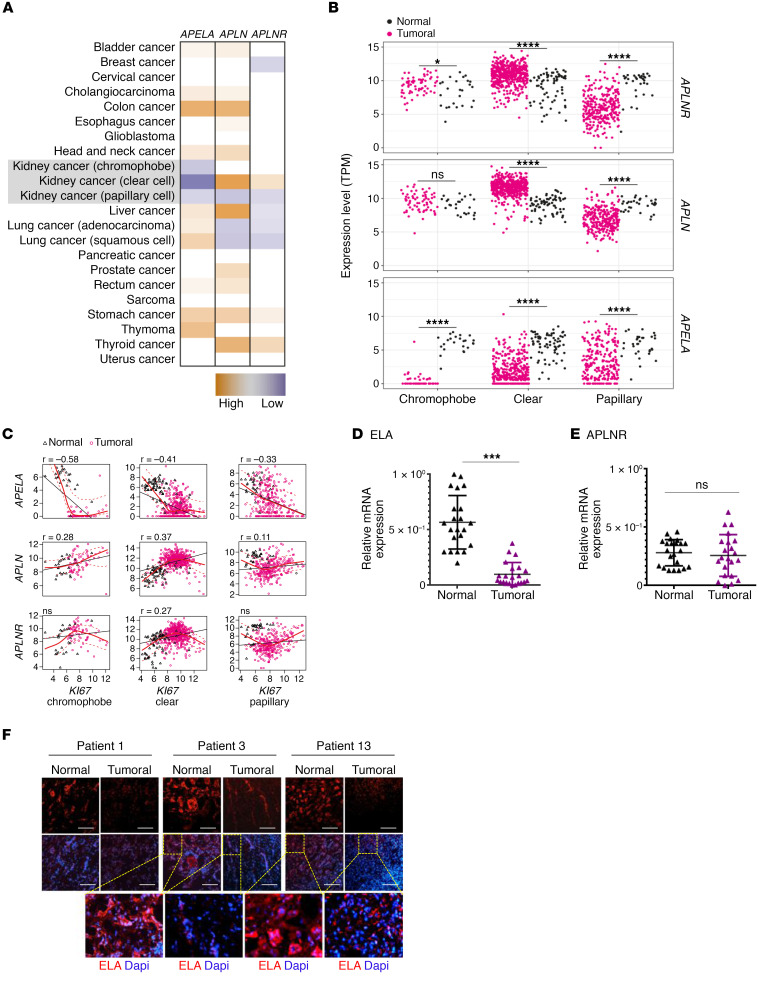
Figure 1. ELA is downregulated in renal cancers.
(A) TCGA data set analysis of ELA, APLN, and APLNR expression in various cancers and their corresponding normal tissues. (B) ELA was systematically repressed in the renal cancer subtypes chromophobe RCC (n = 66), papillary RCC (n = 289), and ccRCC (n = 531) compared with normal kidney tissues (n = 25, n = 32, and n = 72, respectively), as assessed by TCGA. (C) TCGA analysis identified a negative correlation between ELA and KI67 expression in all these renal cancer types. APLN expression was positively correlated with KI67 in all subtypes, and APLNR was positively correlated with KI67 only in ccRCC. (D) Relative expression of ELA mRNA level in 22 pairs of ccRCC tumors and their corresponding adjacent noncancerous tissues. (E) Relative expression of APLNR mRNA in the same samples is given for comparison. The relative amounts of mRNA were normalized against GAPDH mRNA and expressed relative to mRNA abundance in noncancerous tissue for each patient assigned 1 (mean ± SEM; n = 22). (F) Representative immunofluorescence images of renal tumor samples and adjacent healthy tissues from 3 patients (patients 1, 3, and 13) derived from (D–E) that were stained with anti-ELA and DAPI. Unpaired t tests were used to analyze the data. ***P < 0.001, ****P < 0.0001. Scale bar: 150 μm.

