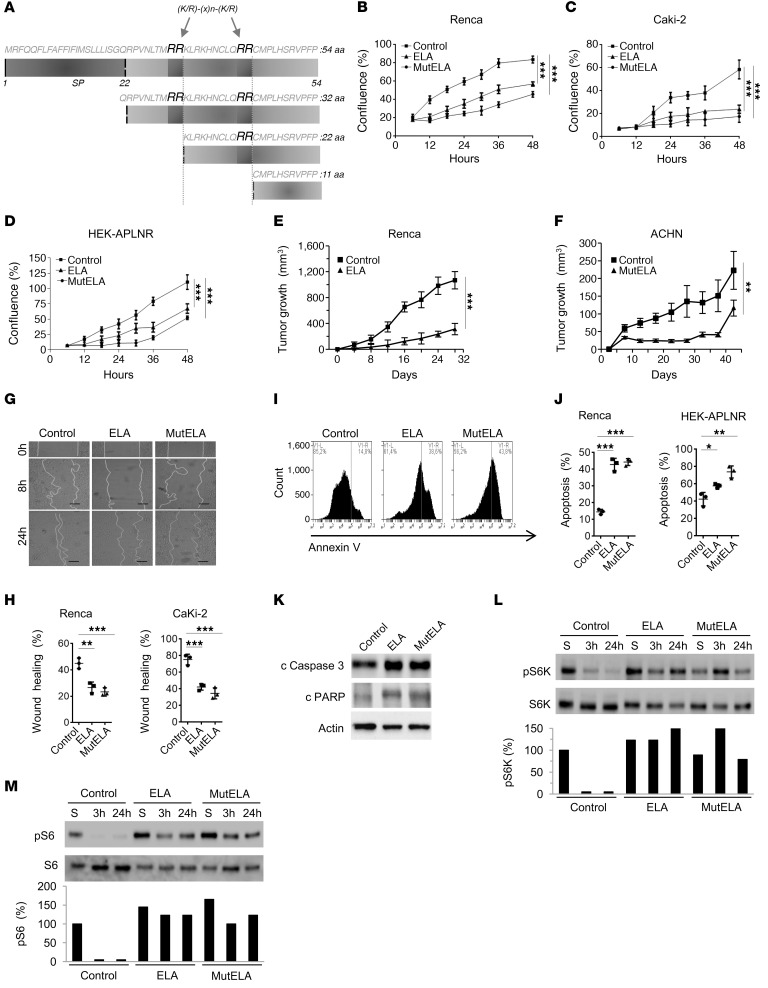
Figure 3. Repression of the malignant phenotype and increased activation of mTORC1 signaling by ELA.
(A) Primary structure of the 54 amino acids (ELA32) of human pre-proEla containing the signal peptide (SP) and ELA precursor (ELA32). The 2 proprotein convertase cleavage sites R31/R32 and R42/R43 that generate the ELA peptides are indicated. (B–D) Growth curves of control Renca (B), Caki-2 (C), and HEK-APLNR cells (D) or stably expressing ELA or mut ELA cDNA. Cells were plated at low confluence for time-lapse phase-contrast videomicroscopy using an IncuCyte microscope, and cell proliferation was monitored by automated confluence analysis at set intervals after plating (means, n = 6 wells per group, 3 independent experiments). (E) Tumor growth curves over time from representative experiment of subcutaneously injected syngeneic BALB/c mice with Renca cells or the same cells stably expressing ELA (n = 7 mice/group, 3 independent experiments). (F) Subcutaneously injected nude mice with the human ACHN cells or the same cells stably expressing mut ELA (n = 7 mice/group). (G) Cell migration was analyzed by scratch wound assay. Control Renca and Caki-2 cells or stably expressing ELA or mut ELA monolayers were subjected to scratch wounds and imaged after 8 hours and 24 hours (n = 6 wells per group, 3 independent experiments). Scale bar: 100 μm. (H) Quantification of wound closure after 24 hours of indicated control cells and the same cells stably expressing ELA or mut ELA. (I) FACS scatter plots of control cells and the same cells stably expressing ELA or mut ELA incubated for 24 hours in the absence of serum and stained with annexin V (n = 3 wells per group, 3 independent experiments). (J) Quantification of apoptosis in Renca and HEK-APLNR cells (annexin V–positive cells) under these conditions is shown. (K) Renca control cells expressing ELA or mut ELA were analyzed for cleaved proapoptotic protein caspase-3 (c caspase-3) and PARP by immunoblotting. (L and M) Western blot analysis of the activation of S6K-pT389 (L) and S6-pS235/236 (M) in control, ELA-expressing, and mut ELA–expressing cells starved for the indicated time period or in the presence of serum (S). Results in K, L, and M are representative of 3 independent experiments each. The mean ± SEM values are shown. One- or 2-way ANOVA with Tukey’s multiple comparisons test were used to analyze data in B, C, D, H, and J. Unpaired t tests were used to analyze the data in E and F. *P < 0.05, **P < 0.01, ***P < 0.001.

