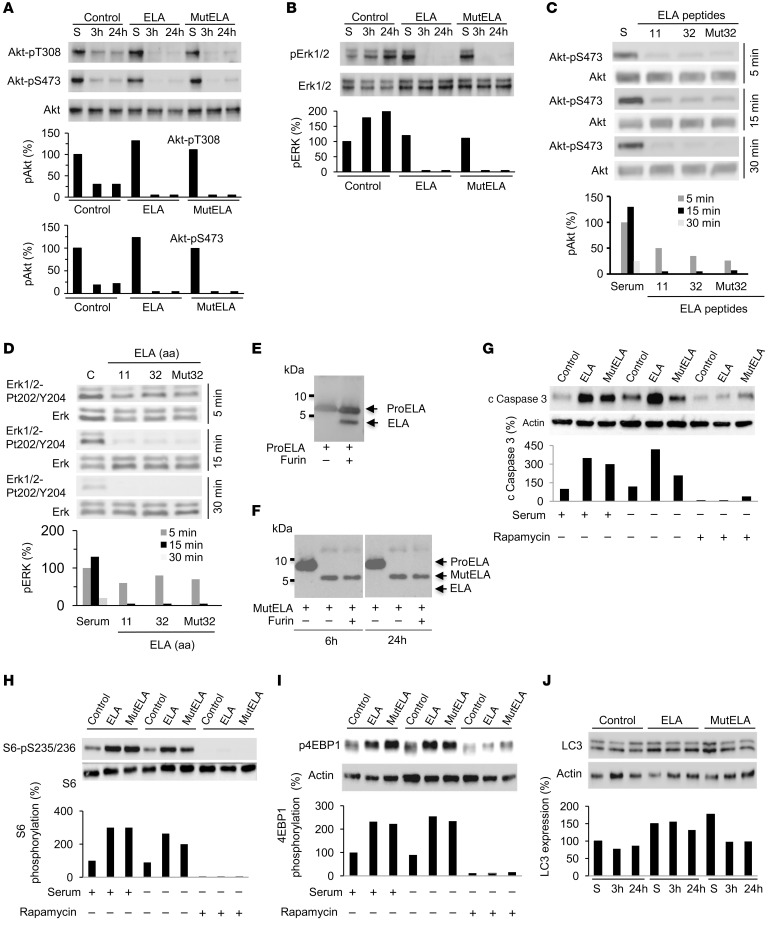
Figure 4. Repression of AKT and ERK activation by ELA and inhibition of ELA-induced mTORC1 signaling by rapamycin.
(A and B) Western blot analysis of the activation of AKT (A) and ERK (B) in control, ELA-expressing, and mut ELA–expressing cells starved for the indicated time period or in the presence of serum (S). (C and D) Control and Renca cells were serum starved and incubated with ELA11, ELA32, or mut ELA32 peptides for indicated time periods and the activation of AKT (C) and ERK (D) were analyzed by Western blot analysis. (E and F) Western blotting analysis using an anti-ELA antibody of WT proELA32 (E) and mut ELA (F) (cleavage sites R31/R32 and R42/R43 were replaced by S31/S32 and S42/S43) peptides incubated with furin (0.2 × 10⁻⁴ U) for 6 or 24 hours. (G) Western blot analysis of cleaved caspase-3 upon rapamycin treatment of control, ELA-expressing, and mut ELA–expressing cells for 24 hours in the absence or presence of serum. Graphs show quantification of cleaved caspase-3. (H and I) Western blot analysis of the activation of S6-pS235/236 (H) and 4EBP1 (I) in control, ELA-expressing, and mut ELA–expressing cells in the absence and presence of rapamycin and/or serum. (J) Western blot analysis of the levels of LC3 in control, ELA-expressing, and mut ELA–expressing cells. Bars denote the corresponding percentages of phosphorylated proteins (n = 3), expressed LC3 protein (n = 3), or cleaved caspase-3 (n = 3). All results shown are representative of at least 3 independent experiments.

