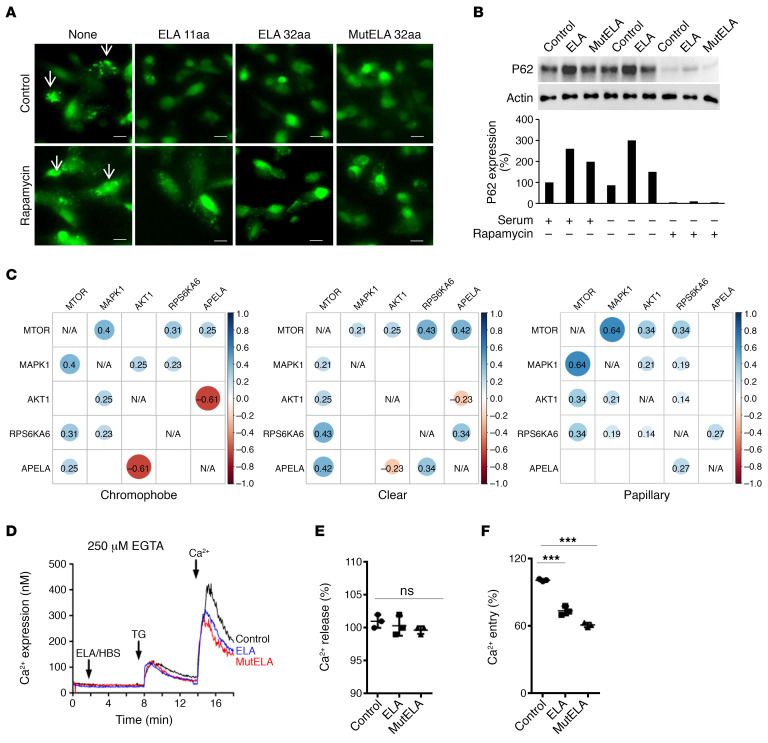
Figure 5. Inhibition of mTOR-mediated autophagy blockade and calcium mobilization by ELA.
(A) GFP-LC3–expressing U2OS cells in the presence or absence of 100 nM ELA-11, ELA-32, or mut ELA-32 peptides and/or rapamycin for 24 hours. Autophagosome formation upon GFP-LC3 aggregation (white arrows) was determined using microscopy. Scale bar: 25 μm. (B) Western blot analysis of the levels of the autophagy protein P62 in control, ELA-expressing, and mut ELA–expressing cells in the absence (24 hours) or presence of serum and/or rapamycin. (C) TCGA data set analysis of correlated expression between APELA and mTOR interactants AKT, ERK, and S6K in indicated renal cancer subtypes compared with normal kidney tissues. (D) Traces of calcium mobilization in HEK/APLNR cells preincubated for 8 minutes in the absence or presence of 100 nM ELA-32 or mut ELA-32 peptides. (E and F) The corresponding percentages of Ca2+ release induced by thapsigargin (TG) (E) and Ca2+ entry (F) are represented as mean ± SEM (n = 3). Bars denote the corresponding percentage of accumulated P62 (n = 3). One-way ANOVA with Tukey’s multiple comparisons test was used to analyze the data. ***P < 0.001. All results shown are representative of at least 3 independent experiments.

