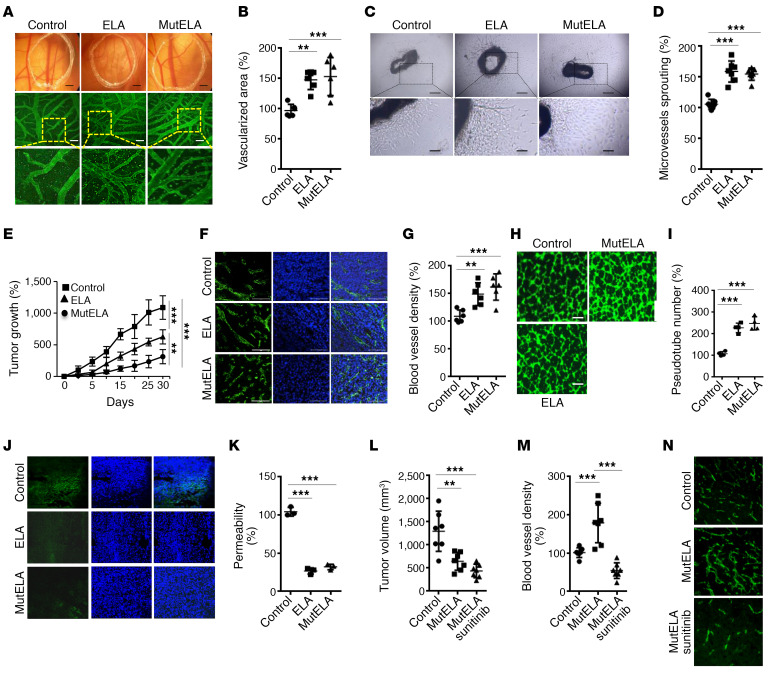
Figure 7. Synergistic effect between mut ELA and sunitinib on tumor growth and angiogenesis repression.
(A) Capillaries of vehicle (control) and ELA peptide– and mut ELA peptide–treated CAMs (100 nM). (B) Quantification of vascularized area relative to control untreated CAMs assigned 100% (n = 6–8). Scale bar represents 2.5 mm for the upper panel and 200 μm for the lower panel. (C) Representative images of untreated (control) and ELA peptide– and mut ELA peptide–treated aortic rings (100 nM). Scale bar indicates 250 μm for the upper panel and 50 μm for the lower panel. (D) Quantification of aortic ring vascular sprout surface per aortic ring relative to control untreated aorta (100%) (n = 6–7). (E) Progression of subcutaneous tumors induced by Renca control cells and ELA- or mut ELA– expressing cells in syngeneic BALB/c mice (n = 7 per group). (F) Developed tumors shown in E were analyzed for angiogenesis using an anti-mouse CD31 monoclonal antibody. (G) Quantification of vascularized area relative to control tumors assigned 100% (n = 6). (H) Analyses of tube-like structure formation in the presence of media derived from Renca control cells and ELA- and mut ELA–expressing cells. (I) Quantification of tube formation via determining the number of cell cluster connections (tube number, n = 6). Scale bar: 200 μm. (J) Confocal images of sections from mice with developed ACHN tumors injected with FITC-dextran. (K) Quantification of vascular permeability to FITC-dextran relative to control tumors assigned 100% (n = 3). (L) Mice were injected subcutaneously with control Renca cells or the same cells stably expressing mut ELA (2 × 10⁵ cells) (n = 7 per group). One week after tumor cell injection, vehicle or sunitinib was administered every 2 days by oral gavage. Tumor size (L) and angiogenesis (M and N) were determined at the end of the experiments. All results shown are representative of at least 3 independent experiments. The mean ± SEM values are shown. One- or 2-way ANOVA with Tukey’s multiple-comparisons test were used to analyze the data. **P < 0.01, ***P < 0.001.

