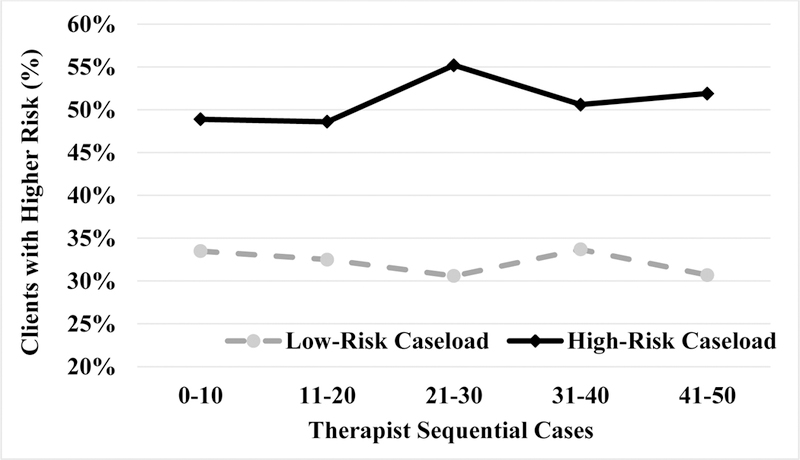
Figure 6.

Percent of clients with pretreatment moderate-high or high PACT risk categories by site caseload (low-risk or high-risk) and the sequential order of the therapist’s cases. We pooled the therapist’s cases into groups of 10 to produce more stable estimates over time. We also pooled the moderate-high and high PACT risk groups to stabilize estimates. The cell entries reflect the percentage of higher risk clients (Moderate High + High) during each 10 case grouping. Numeric values are presented in the web based online supplement Table S6.
