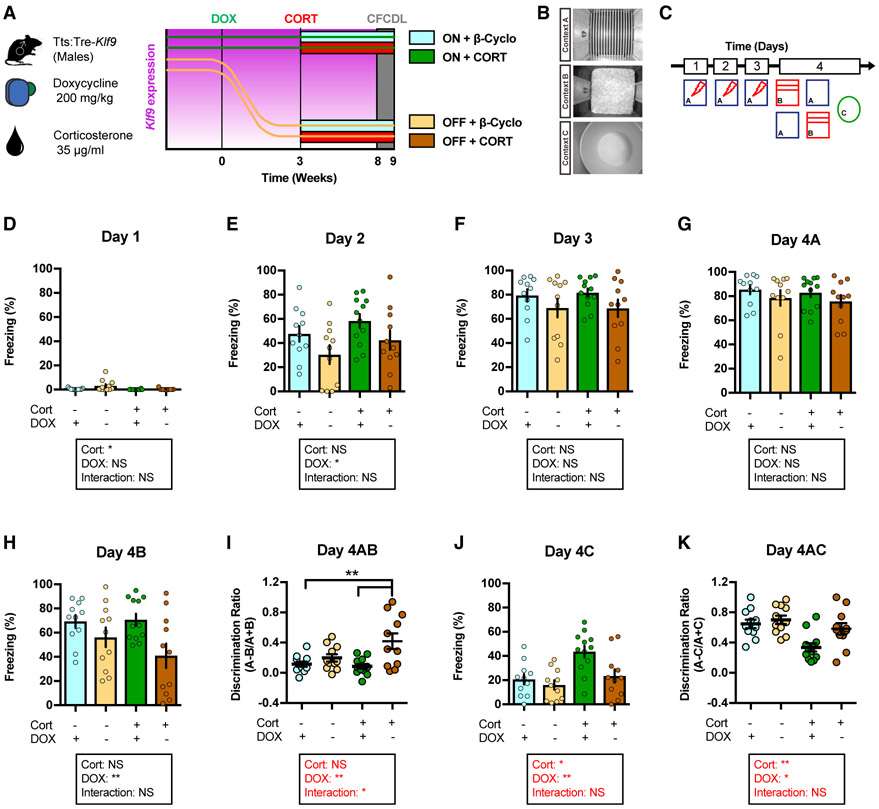
Figure 3. Inducible Silencing of Klf9 Expression in Forebrain Excitatory Neurons of Male Mice Prevents Chronic CORT-Induced Overgeneralization of Contextual Fear.
(A) Schematic representation of tTS:Tre-Klf9 male mice with different doxycycline and corticosterone diet schedules.
(B) CFCDL procedure in which mice were trained to discriminate between a footshock delivered in context A and safe contexts B and C.
(C) Schematic representation of CFCDL timeline consisting of 3 days of training in context A and discrimination tests on day 4.
(D) Freezing behavior on day 1. Data (mean ± SEM; n = 11, 11, 12, and 11 mice per group) were analyzed using mixed-factor two-way ANOVA: corticosterone F(1,41) = 5.32, p < 0.05; doxycycline F(1,41) = 3.71, not significant (NS); interaction F(1,41) = 2.96, NS.
(E) Freezing behavior on day 2. Data (mean ± SEM; n = 11, 11, 12, and 11 mice per group) were analyzed using mixed-factor two-way ANOVA: corticosterone F(1,41) = 2.65, NS; doxycycline F(1,41) = 5.63, p < 0.05; interaction F(1,41) = 0.00, NS.
(F) Freezing behavior on day 3. Data (mean ± SEM; n = 11, 11, 12, and 11 mice per group) were analyzed using mixed-factor two-way ANOVA: corticosterone F(1,41) = 0.02, NS; doxycycline F(1,41) = 3.69, NS; interaction F(1,41) = 0.03, NS.
(G) Freezing behavior on day 4A. Data (mean ± SEM; n = 11, 11, 12, and 11 mice per group) were analyzed using mixed-factor two-way ANOVA: corticosterone F(1,41) = 0.29, NS; doxycycline F(1,41) = 2.18, NS; interaction F(1,41) = 0.00, NS.
(H) Freezing behavior on day 4B. Data (mean ± SEM; n = 11, 11, 12, and 11 mice per group) were analyzed using mixed-factor two-way ANOVA: corticosterone F(1,41) = 0.88, NS; doxycycline F(1,41) = 8.53, p < 0.01; interaction F(1,41) = 1.29, NS.
(I) Discrimination ratio calculated for contexts A and B. Data (mean ± SEM; n = 11, 11, 12, and 11 mice per group) were analyzed using mixed-factor two-way ANOVA: corticosterone F(1,41) = 2.49, NS; doxycycline F(1,41) = 11.67, p < 0.01; interaction F(1,41) = p < 0.05; **p < 0.01, ON CORT OFF DOX versus ON DOX.
(J) Freezing behavior on day 4C. Data (mean ± SEM; n = 11, 11, 12, and 11 mice per group) were analyzed using mixed-factor two-way ANOVA: corticosterone F(1,41) = 10.34, p < 0.01; doxycycline F(1,41) = 6.88, p < 0.05; interaction F(1,41) = 2.67, NS.
(K) Discrimination ratio calculated for contexts A and C. Data (mean ± SEM; n = 11, 11, 12, and 11 mice per group) were analyzed using mixed-factor two-way ANOVA: corticosterone F(1,41) = 12.52, p < 0.01; doxycycline F(1,41) = 6.01, p < 0.05; interaction F(1,41) = 2.44, NS.
See also Figures S1 and S2.

