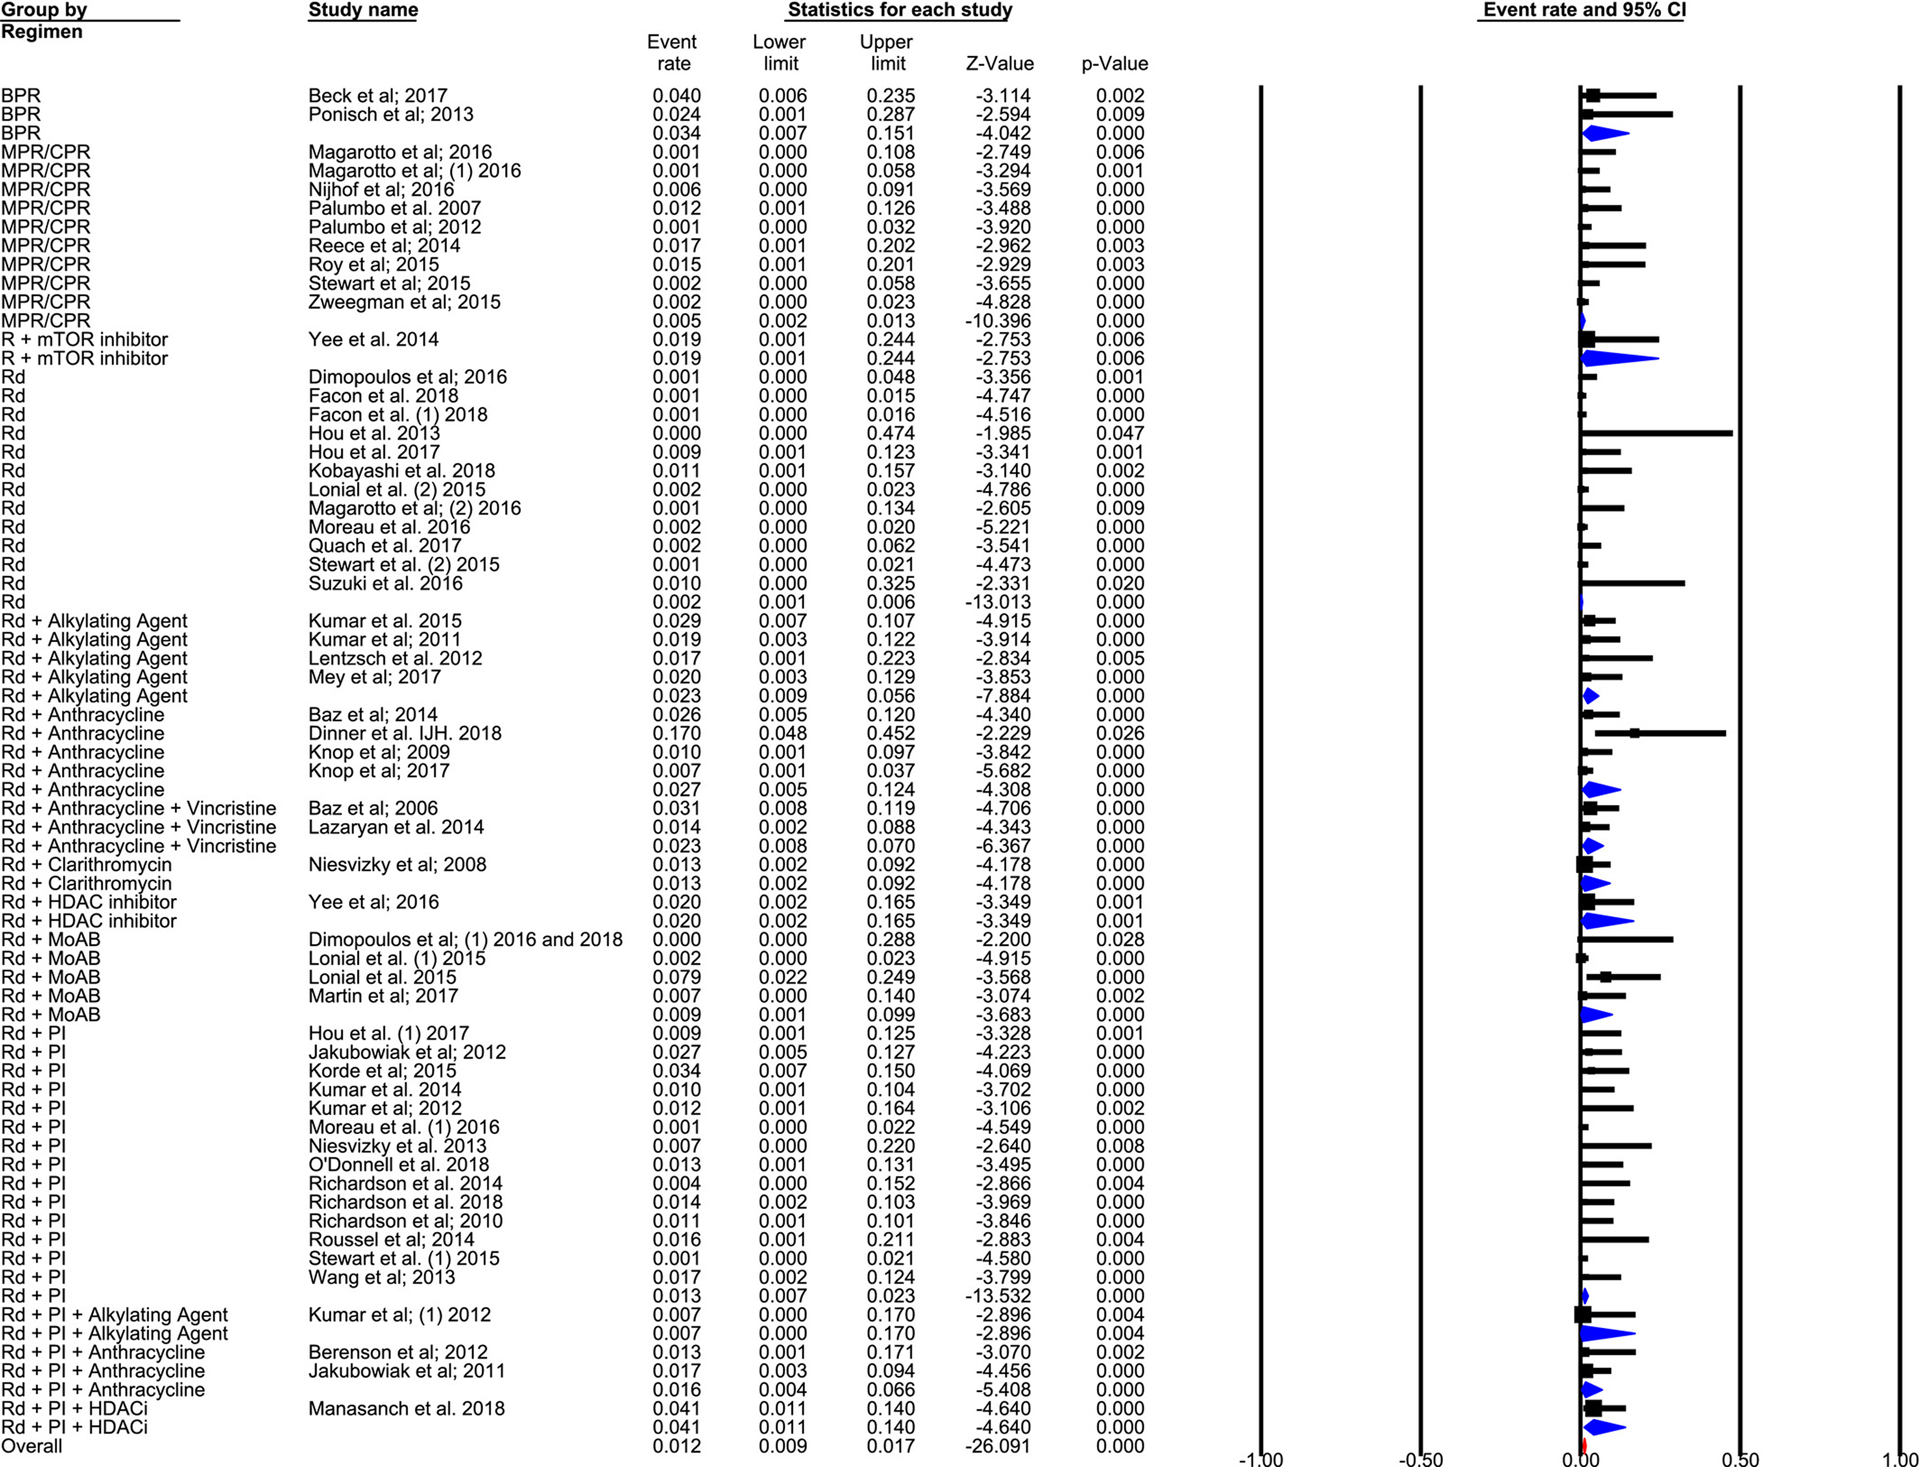
Figure 2.

This forest plot illustrates the percentage of events per 100 patient-cycles for respective therapies. BPR indicates bendamustine, prednisone, and lenalidomide; CPR, cyclophosphamide, prednisone, and lenalidomide; HDACi, histone deacetylase inhibitor; MoAB, monoclonal antibody; MPR, melphalan, prednisone, and lenalidomide; mTORi, mammalian target of rapamycin inhibitor; PI, proteasome inhibitor; R, lenalidomide; Rd, lenalidomide and low-dose dexamethasone.8–10,22–52,54–67
