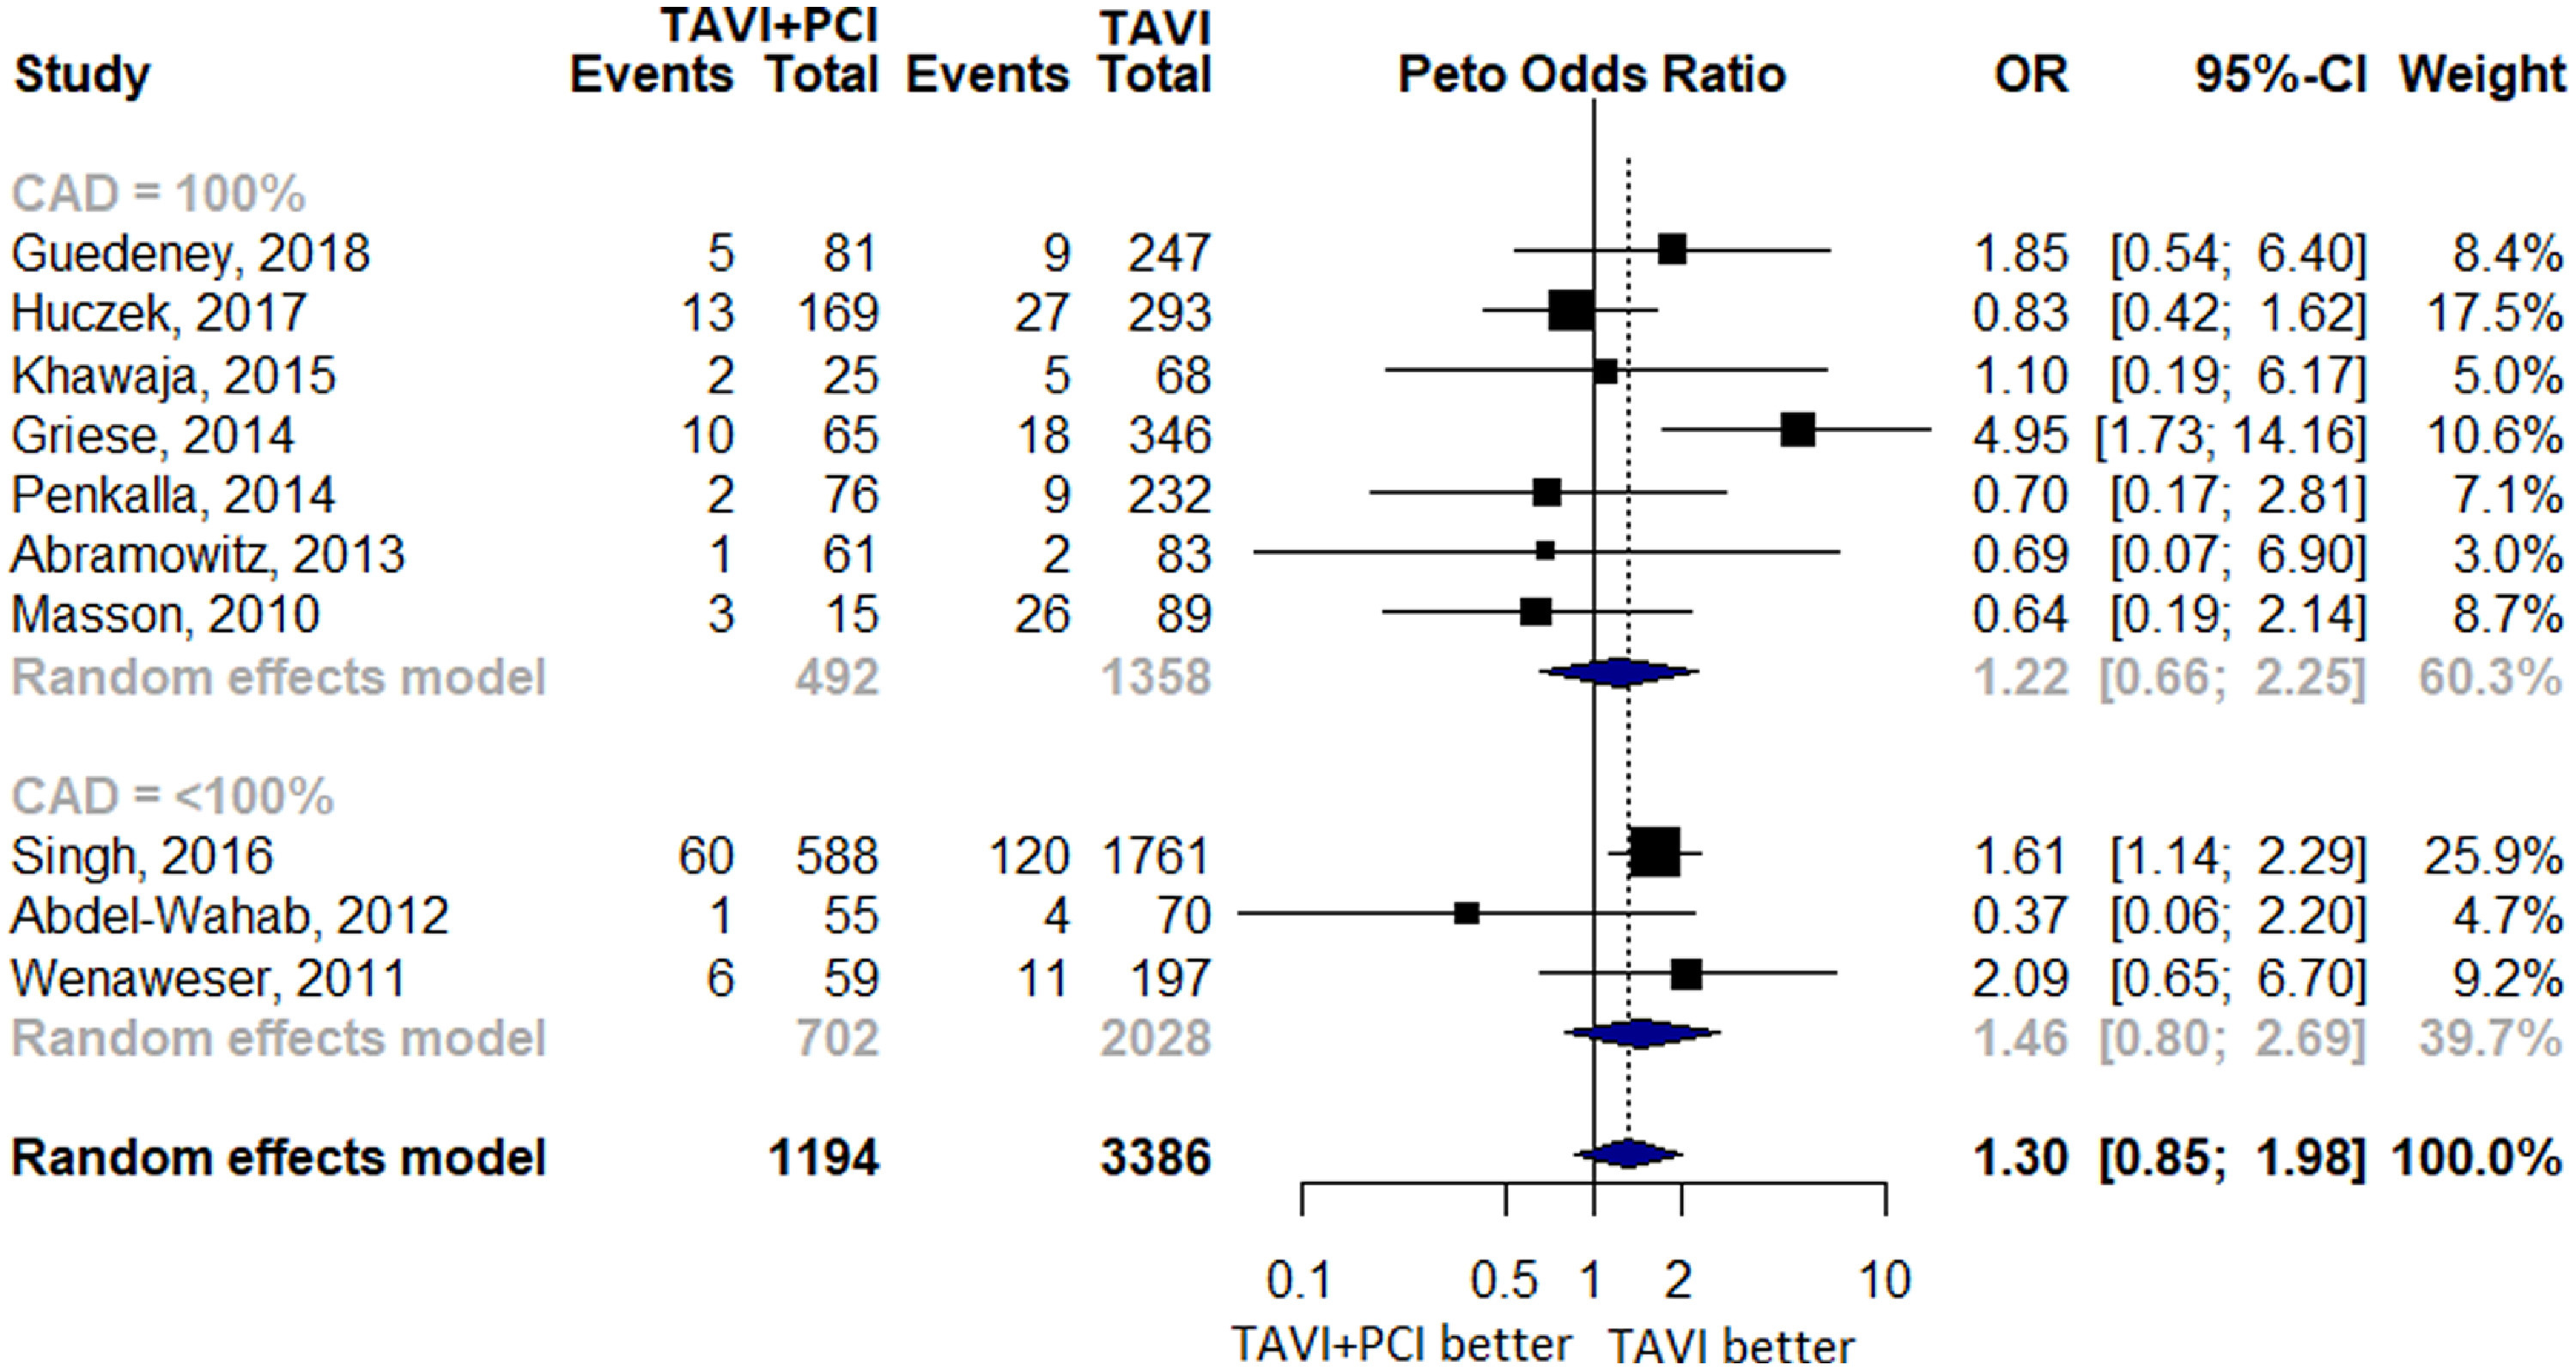
Figure 2.

Forest Plot evaluating the cumulative risk of 30-day all-cause mortality in patients with TAVI and PCI versus TAVI Alone. Other annotations as in Figure 3. Squares represent the risk ratio of the individual studies; Horizontal lines represent the 95% confidence intervals (CI) of the risk ratio. The size of the squares reflects the weight that the corresponding study contributes in the meta-analysis. The diamonds represent the pooled risk ratio or the overall effect. PCI = percutaneous coronary intervention; TAVI = transcatheter aortic valve implantation.
