
FIGURE 3.
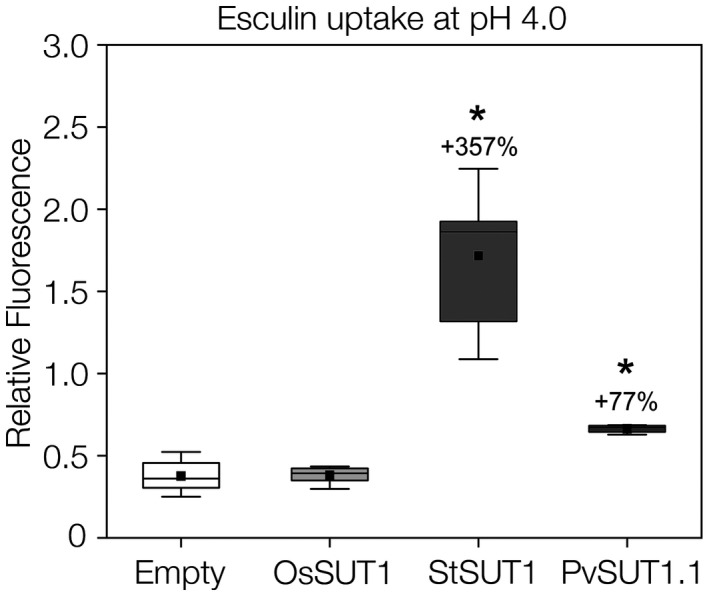
Esculin uptake assay using yeast SEY6210 cells. Potato (StSUT1; type I), rice (OsSUT1; type II), and common bean (PvSUT1.1) sucrose transporters were cloned into yeast expression vector pDR196 and then transformed into yeast cells. In addition to empty vector control, potato and rice transporters were used as positive and negative controls, respectively. Box plots represent relative fluorescence values normalized for cell density (n = 5‐6). Solid black squares represent the mean while the horizontal line inside the box represent the median. Numbers above the boxes indicate percent increase compared to the empty vector control. Asterisk represent significant difference at α = 0.05 level