
FIGURE 6.
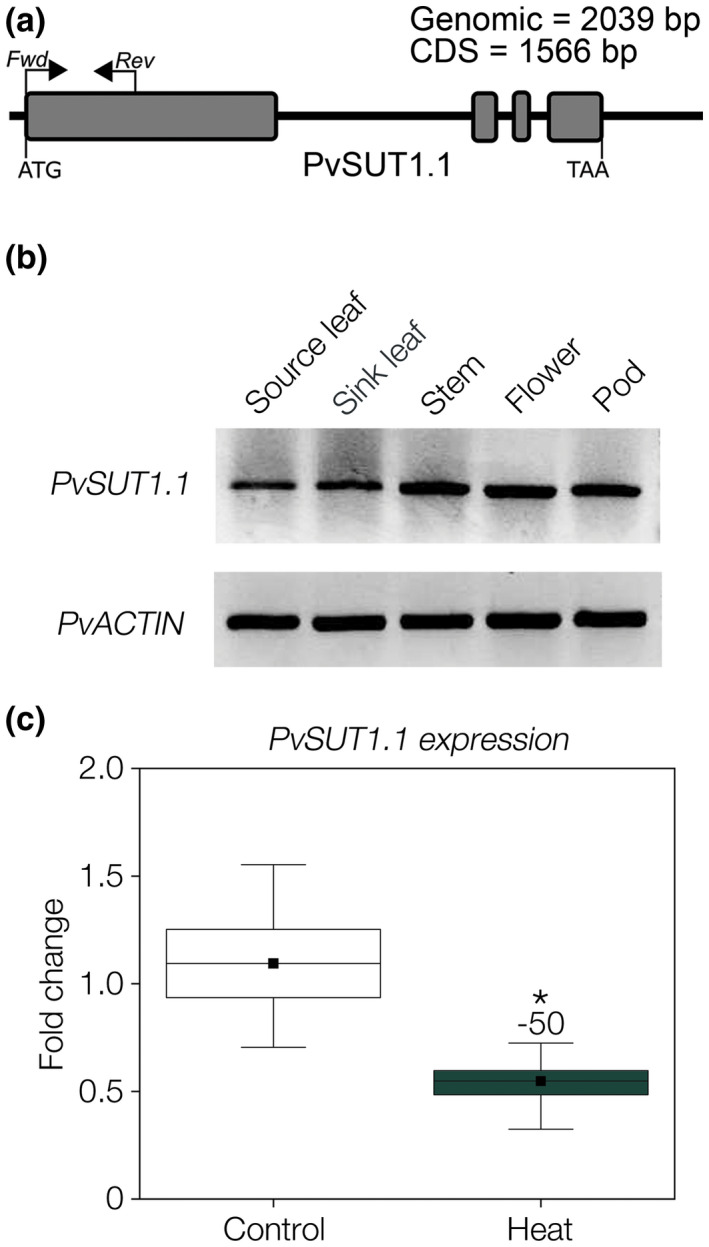
Analysis of PvSUT1.1 expression in common bean. (A) Gene model of PvSUT1.1 showing the primers used for RT‐PCR and qRT‐PCR. (B) Tissue expression analysis of PvSUT1.1 using RT‐PCR. PvACTIN was used as internal control for equal amounts of RNA. (C) Expression of PvSUT1.1 in source leaves exposed to ambient or elevated temperature (32°C) using qRT‐PCR (n=9)