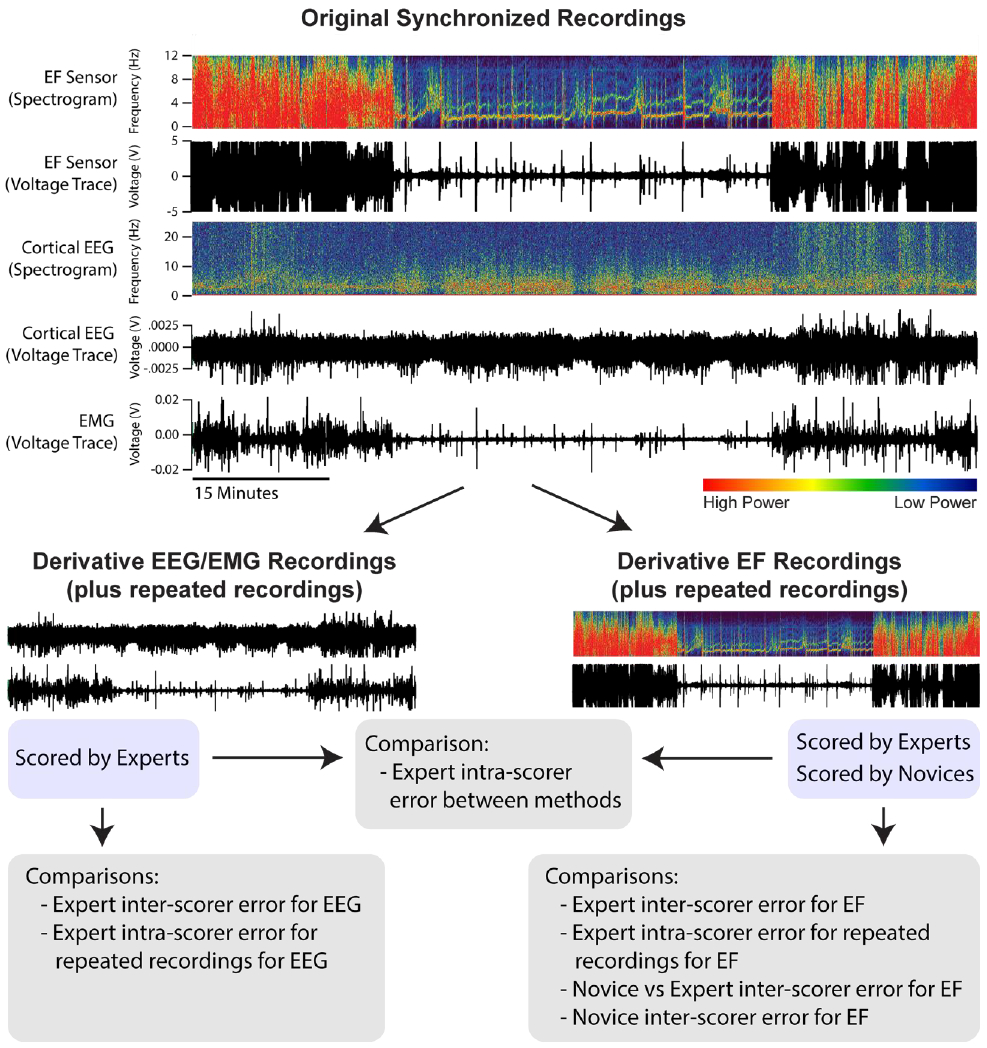
Figure 2. Recording Set-Up for and Creating Definitions for Scoring.

Each recording is created as synchronous voltage traces from electric field (EF), electroencephalogram (EEG), and electromyogram (EMG). As an example, one EF and EEG voltage trace are also represented as a spectrogram – a graphic in which the x-axis is time, the y-axis is frequency, and the color intensity denotes the power of respective frequencies present in the voltage trace. Each synchronized recording (8 total) is divided into two files that contain either the EEG/EMG or EF voltage traces for subsequent scoring and comparison.
