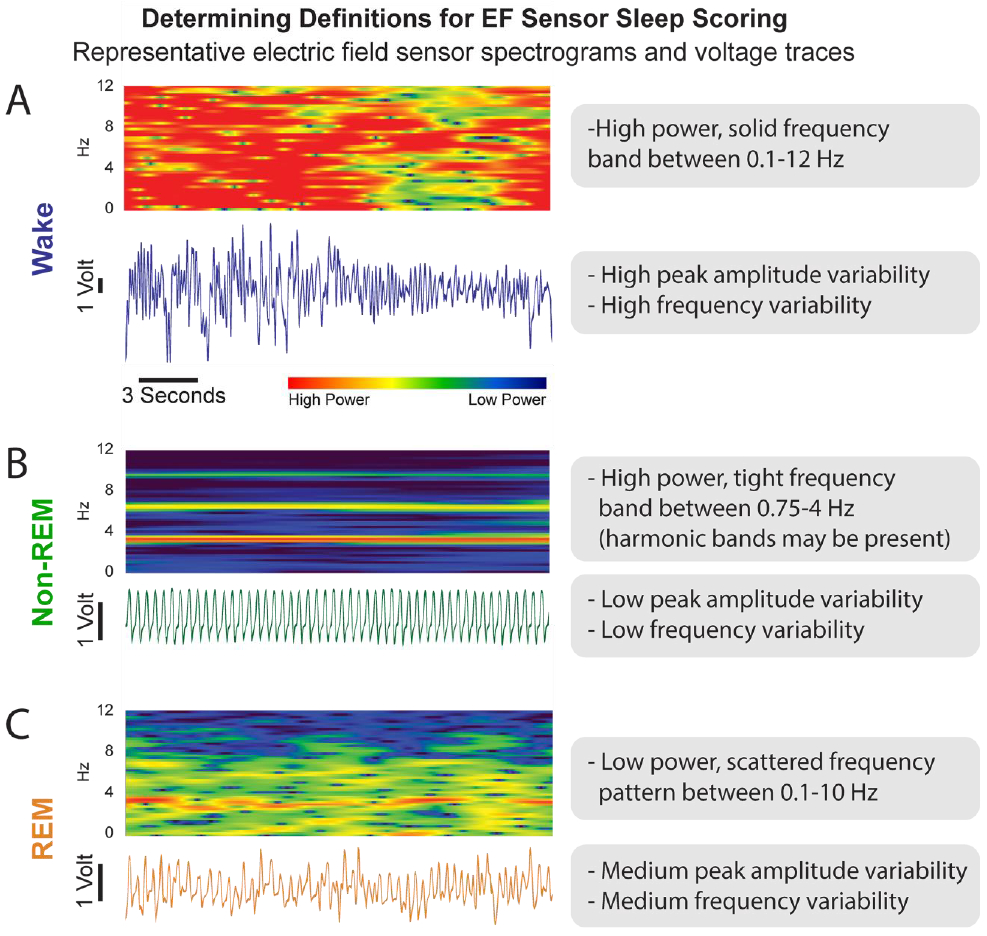
Figure 3. Wake, Non-REM Sleep, and REM Sleep Features are Unique for Electric Field (EF) Sensor Voltage Trace and Spectrogram.

A) The EF sensor wake state data appears as both a spectrogram (top) and voltage trace (bottom in blue). Each voltage trace is the direct output from the EF sensors and represent animal movement. B) EF data for non-REM sleep (green) behavior. C) EF data for REM sleep (orange) behavior.
