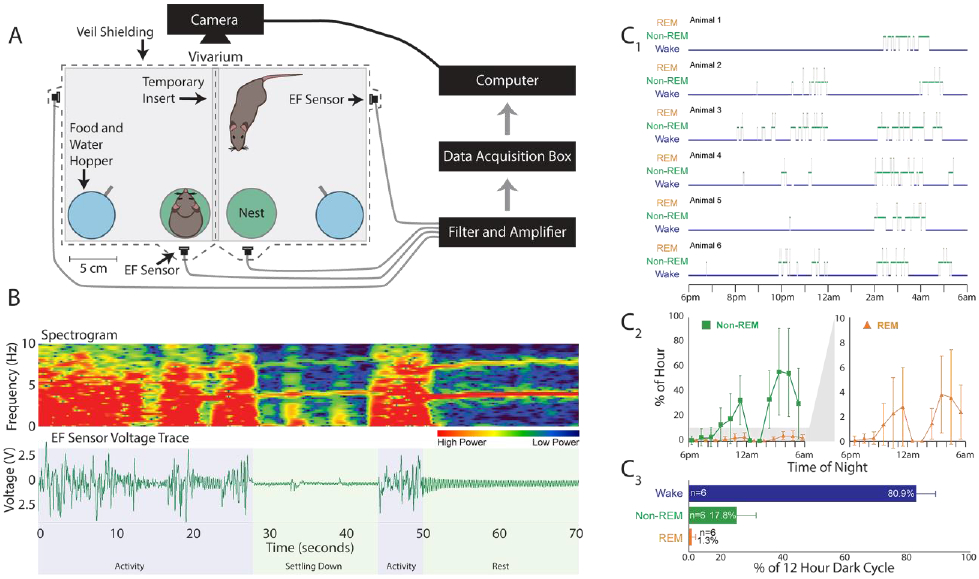
Figure 4. Home-Cage Set-up with only Electric Field (EF) Sensors and Description of 12-Hour Dark Cycle Sleep-Wake Staging.

A) Home-cage set-up in which the animals are separated by a transparent shielded insert during testing that allows visual, olfactory, and thermal interactions between the animals. Each animal has free access to food and water and a 60 mm Petri dish to use as a nest. The electric field (EF) sensors are attached to the home-cage exterior and connected to a filter/amplifier box, an Axon instruments data acquisition box, then to the computer. B) Representative spectrogram and raw voltage trace from home-cages that are indistinguishable from the data collected on the electroencephalogram/electromyogram (EEG/EMG) validation cages. C1) three-state hypnogram describing the sleep results for 6 animals recorded overnight between 6pm and 6am. C2) The average percentage of sleep (non-rapid eye movement – non-REM – sleep plus REM sleep time) of all 6 animals per hour over the 12 hours. C3) The 12-hour average of all 6 animals for each arousal state. Data are presented as mean ± standard deviation.
