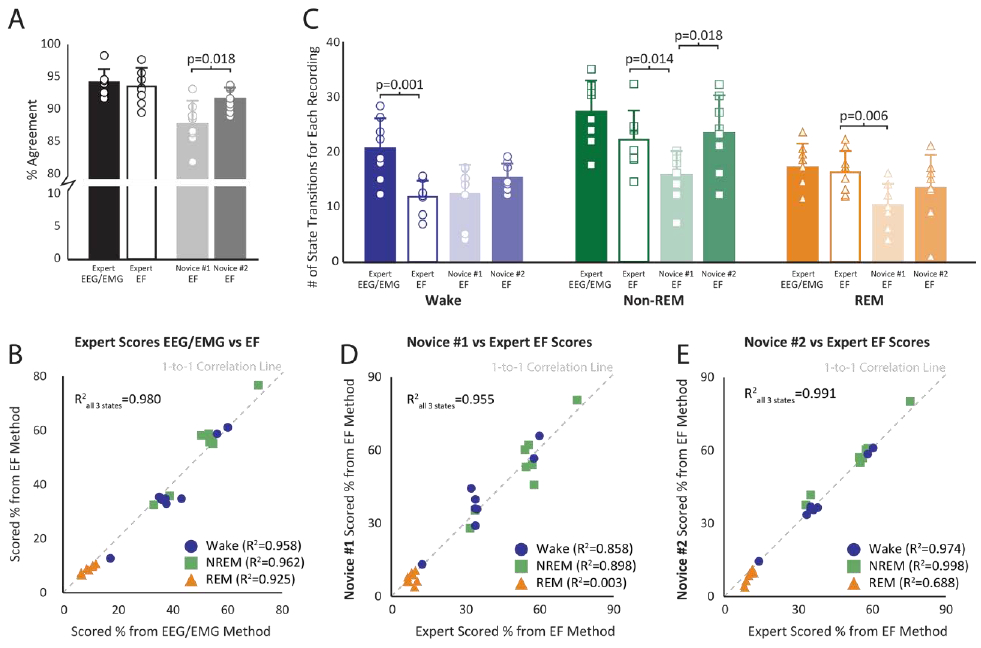
Figure 5. Agreement Between Electric Field (EF) and Electroencephalogram/Electromyogram (EEG/EMG) Sleep-Wake Scoring Methods.

A) The black and white bars represent expert intra-scorer agreement for both electric field (EF) and electroencephalogram/electromyogram (EEG/EMG) methods. The light and dark gray bars represent novice agreements with expert scores for the EF sleep-wake scoring method. The bars represent the mean ± standard deviation. The circles represent the specific results from each of the 8 files. B) A correlation between the EEG/EMG and EF three-state sleep-wake scoring results for each of the 8 files. Percent time spent in wake (blue circle), non-rapid eye movement (non-REM) sleep (green square), and REM sleep (orange triangle) were calculated for each file and represent the average score from the three expert scorers. C) Bar (mean ± standard deviation) and raw data for each recording representing the number of calculated state transitions for each scoring method (EF vs EEG/EMG) and scorer skill (novice vs expert). D) Novice #1’s three-state scoring results for each file plotted against the average three expert scorers’ results for the EF sensor method. Novice #1 self-trained using only the Supplement 2 document. E) Novice #2’s three-state scoring results for each file plotted against the average three expert scorers’ results for the EF method. Novice #2 used both Supplement 2 and Supplement 3 to iteratively self-train and improve sleep skill prior to scoring data.
