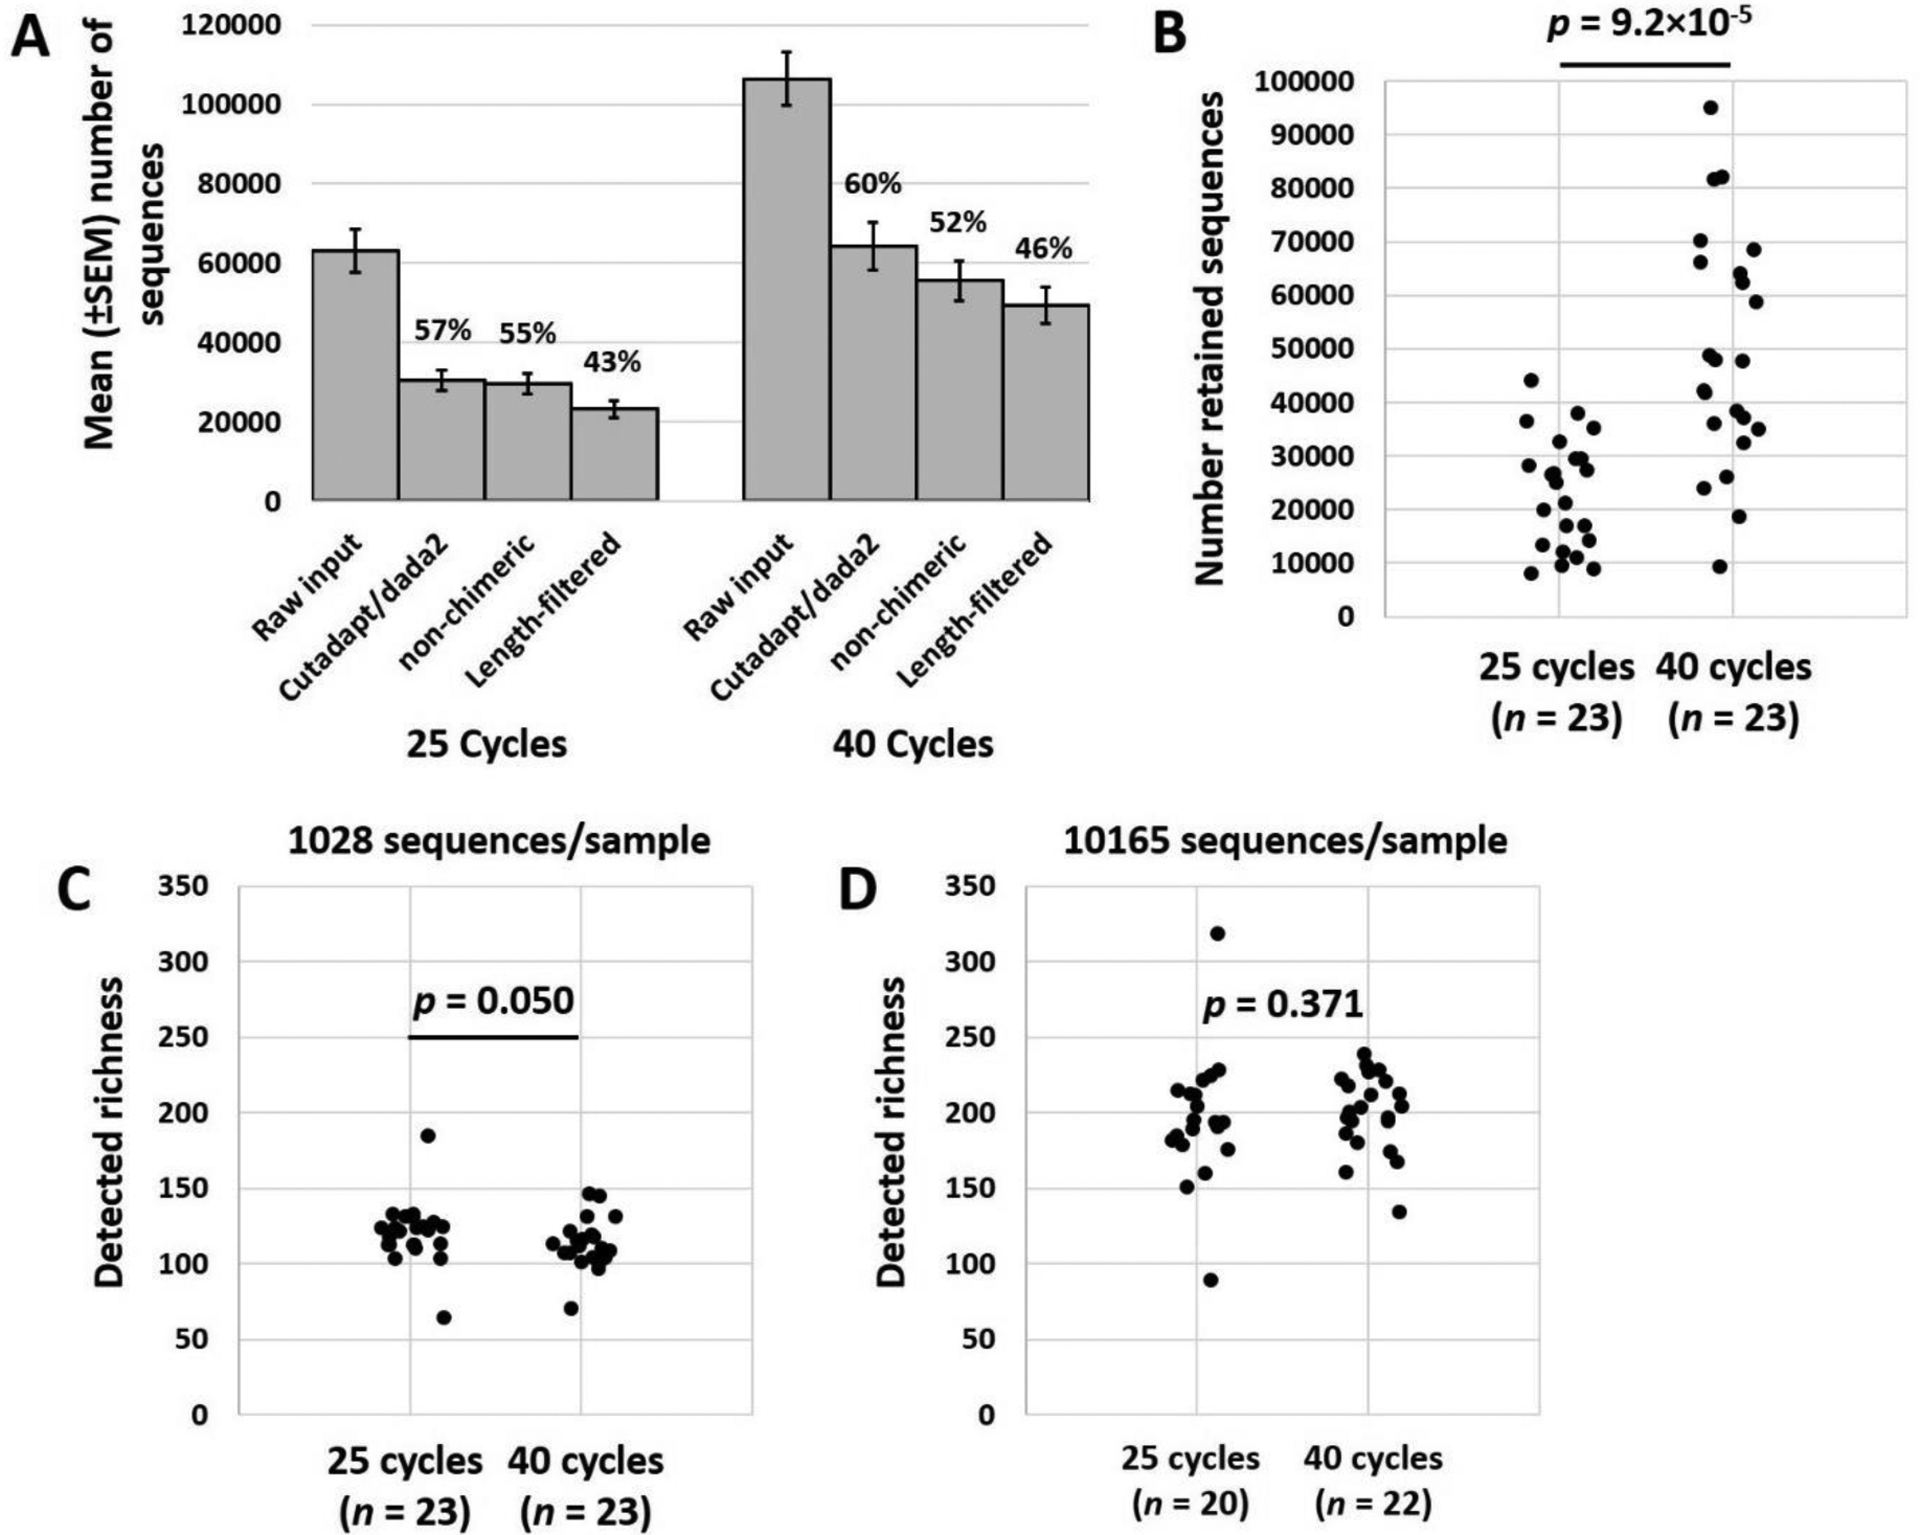
Figure 3.

Histograms showing the number of sequences retained at each level of data filtering from DNA extracted from matched pelage samples (n = 23), and amplified for 25 or 40 PCR cycles (A). Dot plots show the total number of sequences retained at each cycle number (B), and the detected richness in datasets subsampled to a uniform depth of 1028 sequences (C) or 10165 sequences (D) per sample.
