
Figure 5.
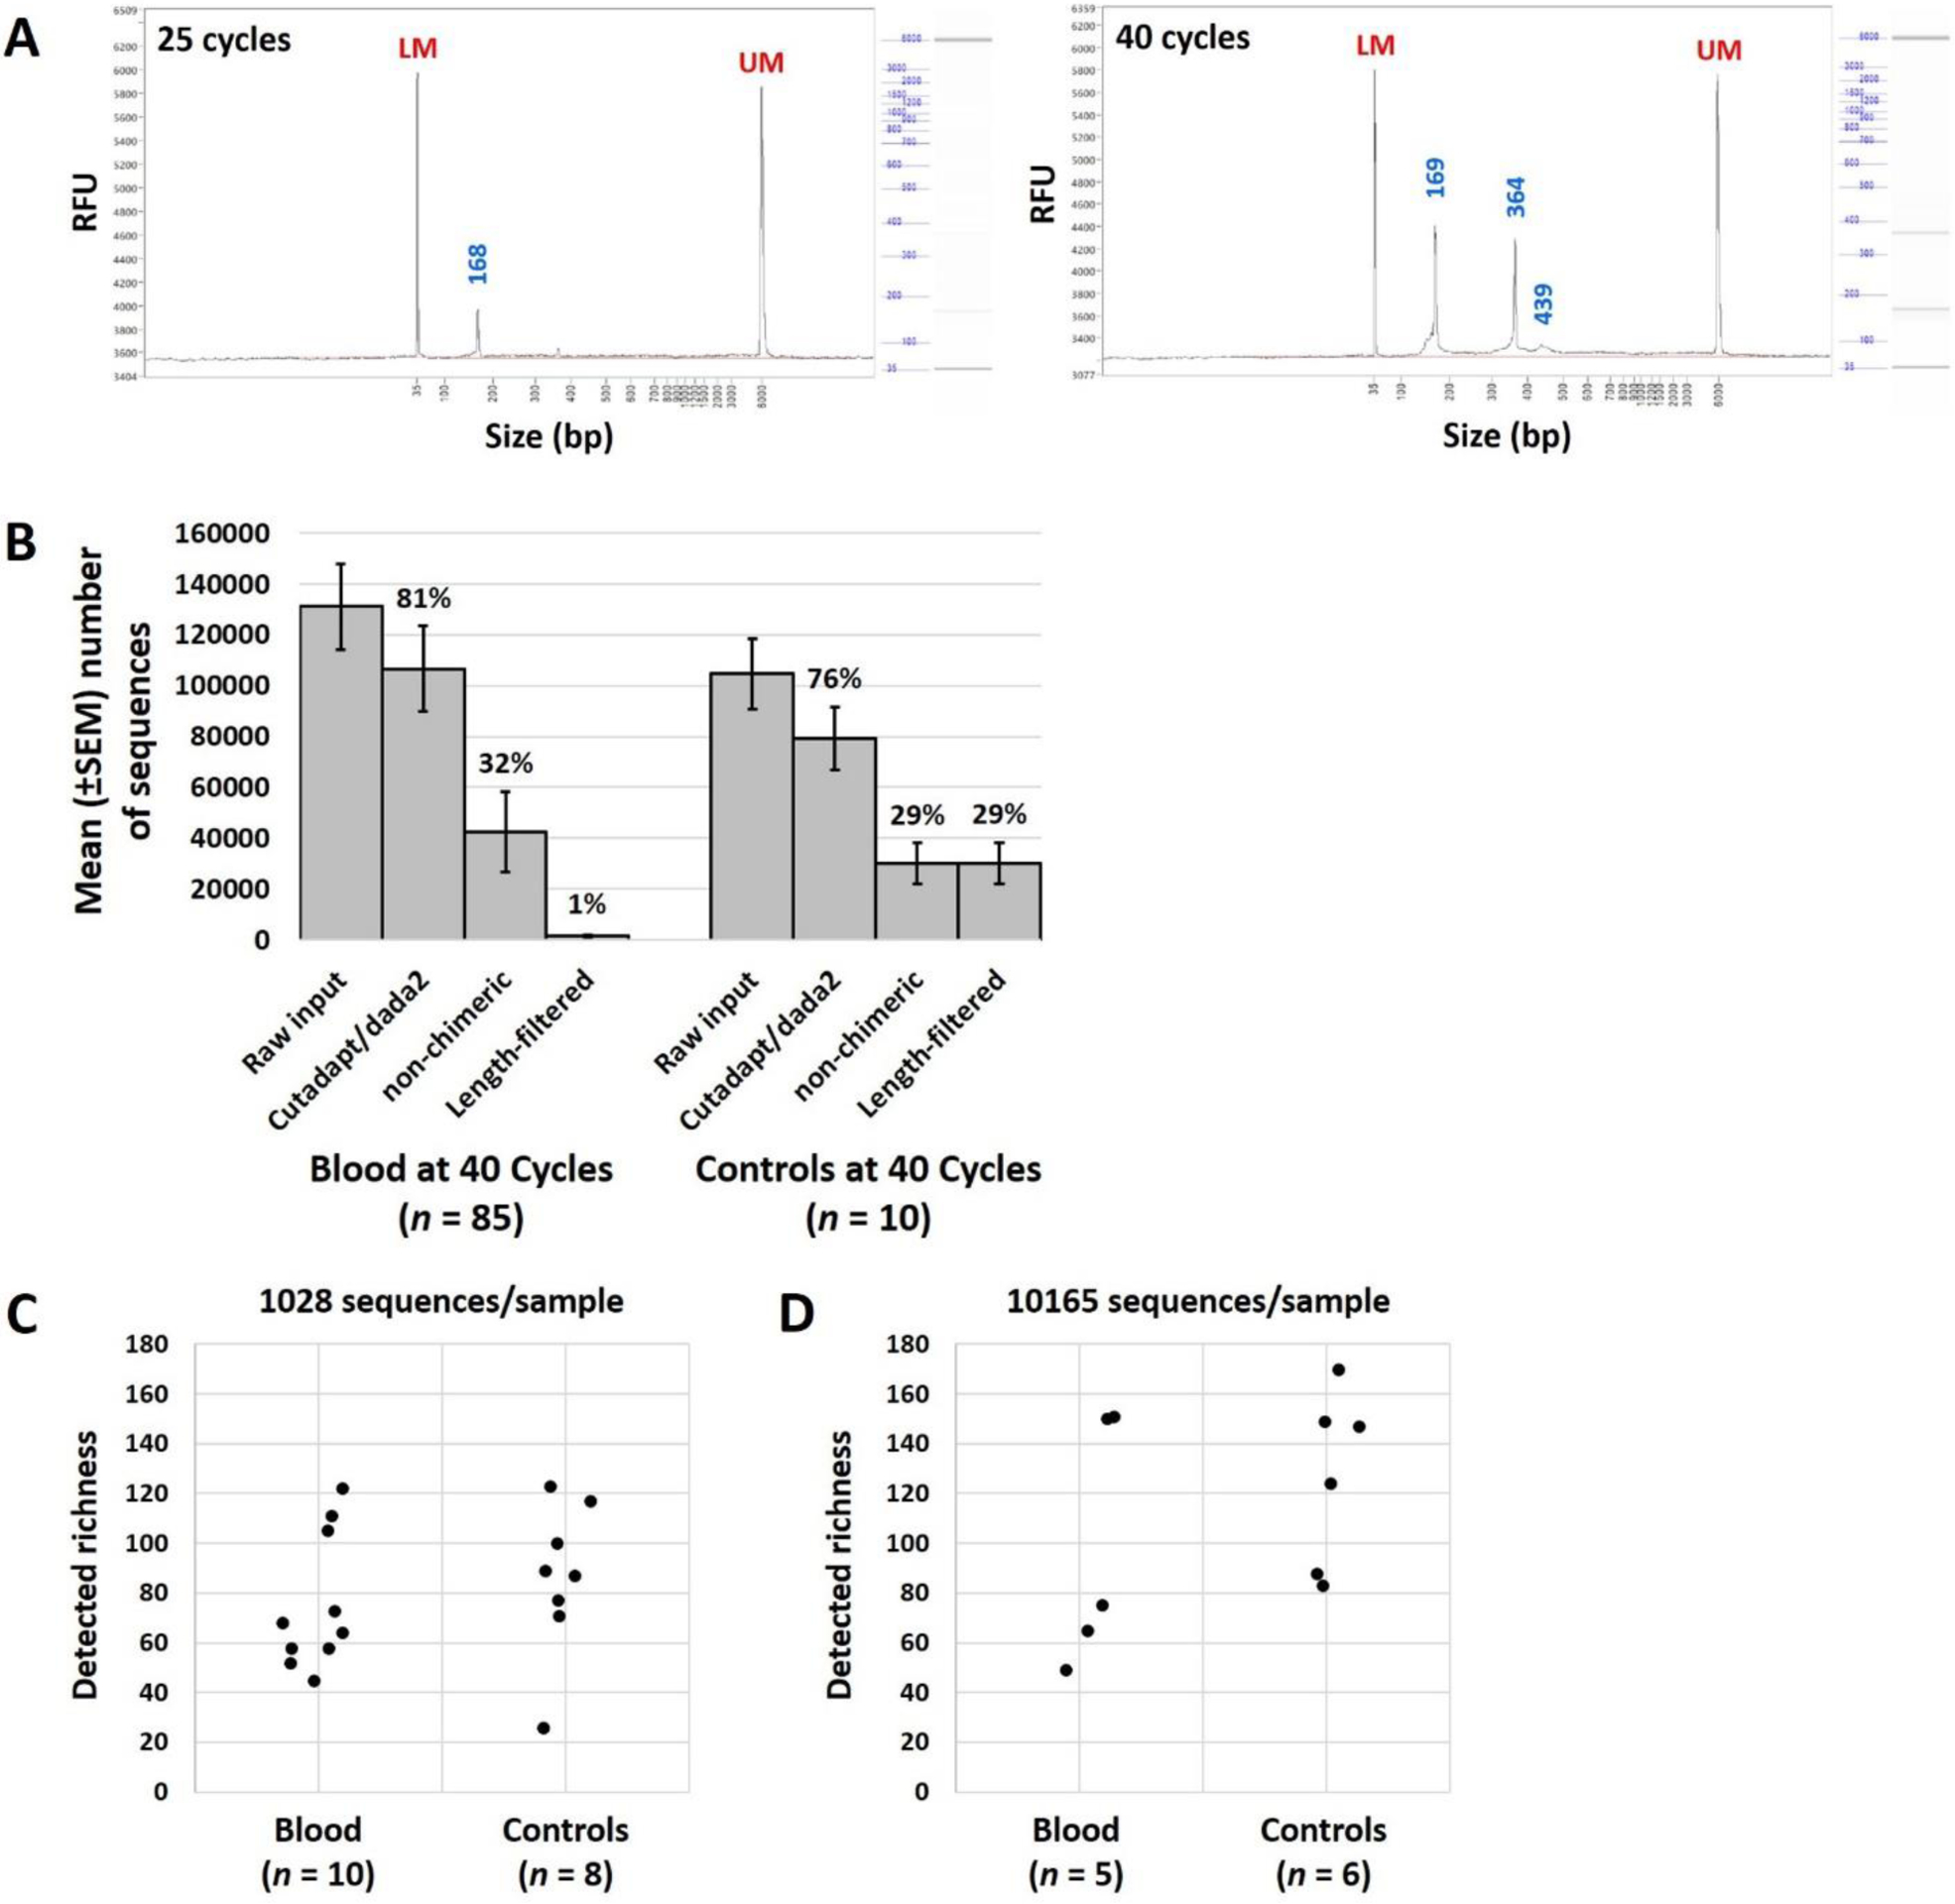
Quantification of amplified DNA at 439 bp in pooled 16S rRNA libraries generated from murine blood (n = 85) amplified for 25 or 40 cycles (A); histograms showing the number of sequences retained at each level of data filtering from DNA extracted from blood samples (n =853) and reagent controls (n = 10), and amplified for 40 PCR cycles (B). Dot plots show the detected richness in datasets subsampled to a uniform depth of 1028 sequences (C) or 10165 sequences (D) per sample.