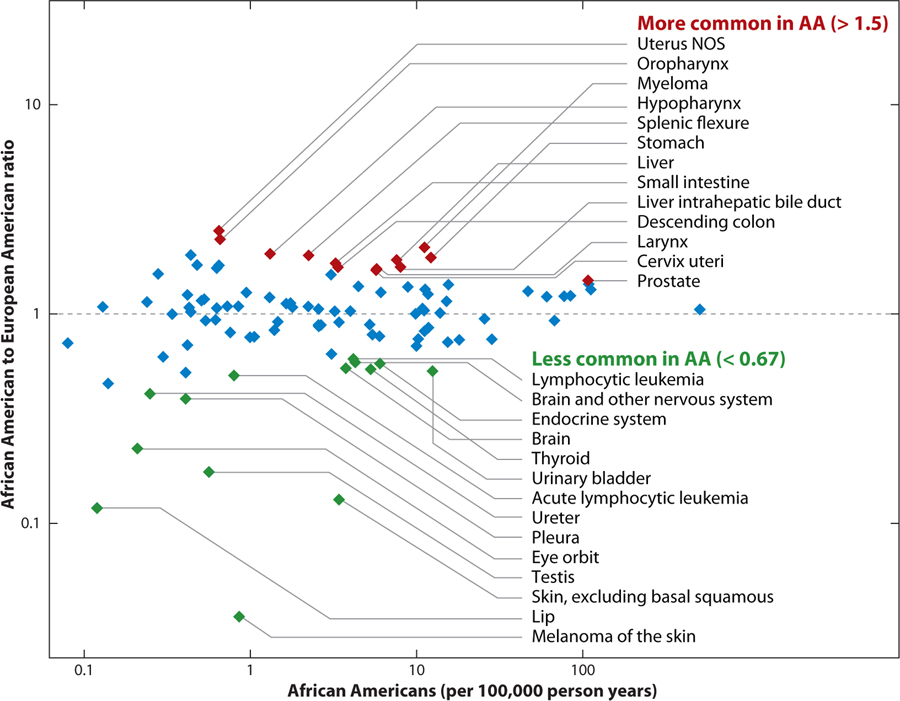
Figure 9.
Relative frequencies of cancers in African Americans and European Americans. Cancers with significant differences in frequency (red or green) are potential targets for admixture mapping. Data were extracted using SEER software using U.S. cancer incidence from 2000–2005, age adjusted using 2000 census results as the standard. Incidence rates were calculated separately for European (EA) and American Americans (AA) for the number of cases per 100,000 person years.

